OpenLLMetry: Boost Your LLM Application's Observability

OpenLLMetry, a set of extensions built on top of OpenTelemetry, is the perfect solution for developers seeking complete observability over their Language Learning Model (LLM) applications.
This open-source tool provides comprehensive insights into your applications, contributing to improved performance and more efficient debugging.
Advantage
One significant advantage of OpenLLMetry is its compatibility with existing observability solutions like Datadog and Honeycomb. This is thanks to its foundation on OpenTelemetry, allowing for seamless integration and enhanced functionality.
OpenLLMetry comes equipped with standard OpenTelemetry instrumentations for LLM providers and Vector DBs. Additionally, the Traceloop SDK makes the onboarding process a breeze, outputting standard OpenTelemetry data that can be connected to your observability stack.
If you already have OpenTelemetry instrumented, adding any of the OpenLLMetry instrumentations is a straightforward process.
Easy Set-Up and Customization
Getting started with OpenLLMetry is as easy as installing the SDK with 'pip install traceloop-sdk'.
Once installed, simply add the initialization code to your project, and voila - you're now tracing your code with OpenLLMetry! For local development, you can disable batch sending to see the traces immediately.
Broad Range of Supported Destinations
OpenLLMetry supports and has been tested with a wide range of destinations, including Traceloop, Dynatrace, Datadog, New Relic, Honeycomb, Grafana Tempo, HyperDX, SigNoz, Splunk, OpenTelemetry Collector, and IBM Instana.
Detailed instructions for connecting to each destination are available in the documentation.
Extensive Instrumentation
OpenLLMetry can instrument everything that OpenTelemetry already instruments, including your database and API calls. However, it goes a step further with custom extensions that instrument calls to various LLM Providers like OpenAI, Anthropic, Cohere, Ollama, Mistral AI, and HuggingFace, among others.
It also instruments Vector DBs such as Chroma, Pinecone, Qdrant, Weaviate, and Milvus.
Install
The easiest way to get started is to use our SDK. For a complete guide, go to our docs.
Install the SDK:
pip install traceloop-sdk
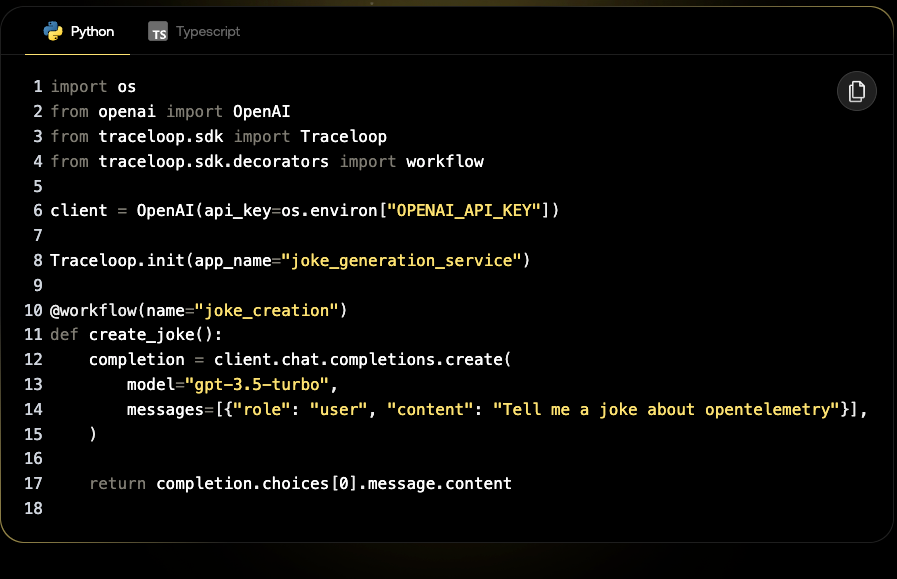
Then, to start instrumenting your code, just add this line to your code:
from traceloop.sdk import Traceloop

Traceloop.init()
That's it. You're now tracing your code with OpenLLMetry! If you're running this locally, you may want to disable batch sending, so you can see the traces immediately:
Traceloop.init(disable_batch=True)
Conclusion
Whether you're a seasoned developer or just getting started with LLM applications, OpenLLMetry is a valuable addition to your toolkit.
Its seamless integration, easy setup, and extensive instrumentation make it an excellent choice for enhancing your application's observability. So, why wait? Get started with OpenLLMetry today and take your LLM application to the next level!
License
The app is released under the Apache-2.0 License.
Resources
 traceloop
