23 Open-source Free Database Monitoring Solutions for MySQL, Oracle, Postgres, and MSSQL


Database monitoring solutions are crucial for ensuring the optimal performance and health of databases.
Why it is important to monitor your databases?
 Hazem Abbas
Here are some reasons why they are important:
- Performance Optimization: Database monitoring helps identify performance bottlenecks, such as slow queries or resource-intensive operations. By monitoring key metrics, administrators can optimize query execution, identify inefficiencies, and improve overall database performance.
- Issue Detection and Diagnosis: Monitoring solutions enable the detection and diagnosis of issues in real-time.
They provide alerts and notifications for anomalies, errors, or potential problems, allowing administrators to take proactive measures and resolve issues before they impact the database's functionality. - Capacity Planning: Database monitoring helps in capacity planning by providing insights into resource utilization, such as CPU, memory, and storage.
Administrators can analyze trends, forecast future needs, and make informed decisions regarding scalability and infrastructure requirements. - Security and Compliance: Monitoring solutions help ensure the security and compliance of databases. They can track and monitor access, detect unauthorized activities, and provide audit trails for compliance purposes. This helps organizations maintain data integrity and meet regulatory requirements.
Advantages of Database Monitoring Tools
Advantages of using a database monitoring solution include:
- Improved Performance: Monitoring solutions allow for proactive performance optimization, leading to faster query execution and improved response times.
- Reduced Downtime: By detecting and resolving issues in real-time, monitoring solutions minimize downtime and ensure uninterrupted access to the database.
- Enhanced Scalability: Monitoring solutions provide insights into resource utilization, enabling administrators to scale resources as needed to accommodate growing database demands.
- Cost Savings: By optimizing performance, preventing issues, and improving resource allocation, database monitoring solutions can help reduce operational costs associated with database management.
- Data-driven Decision Making: Monitoring solutions provide valuable insights and metrics, enabling administrators to make data-driven decisions for capacity planning, resource allocation, and performance optimization.
Hazem Abbas
In the following list, you will find the best open-source free database monitoring solutions.
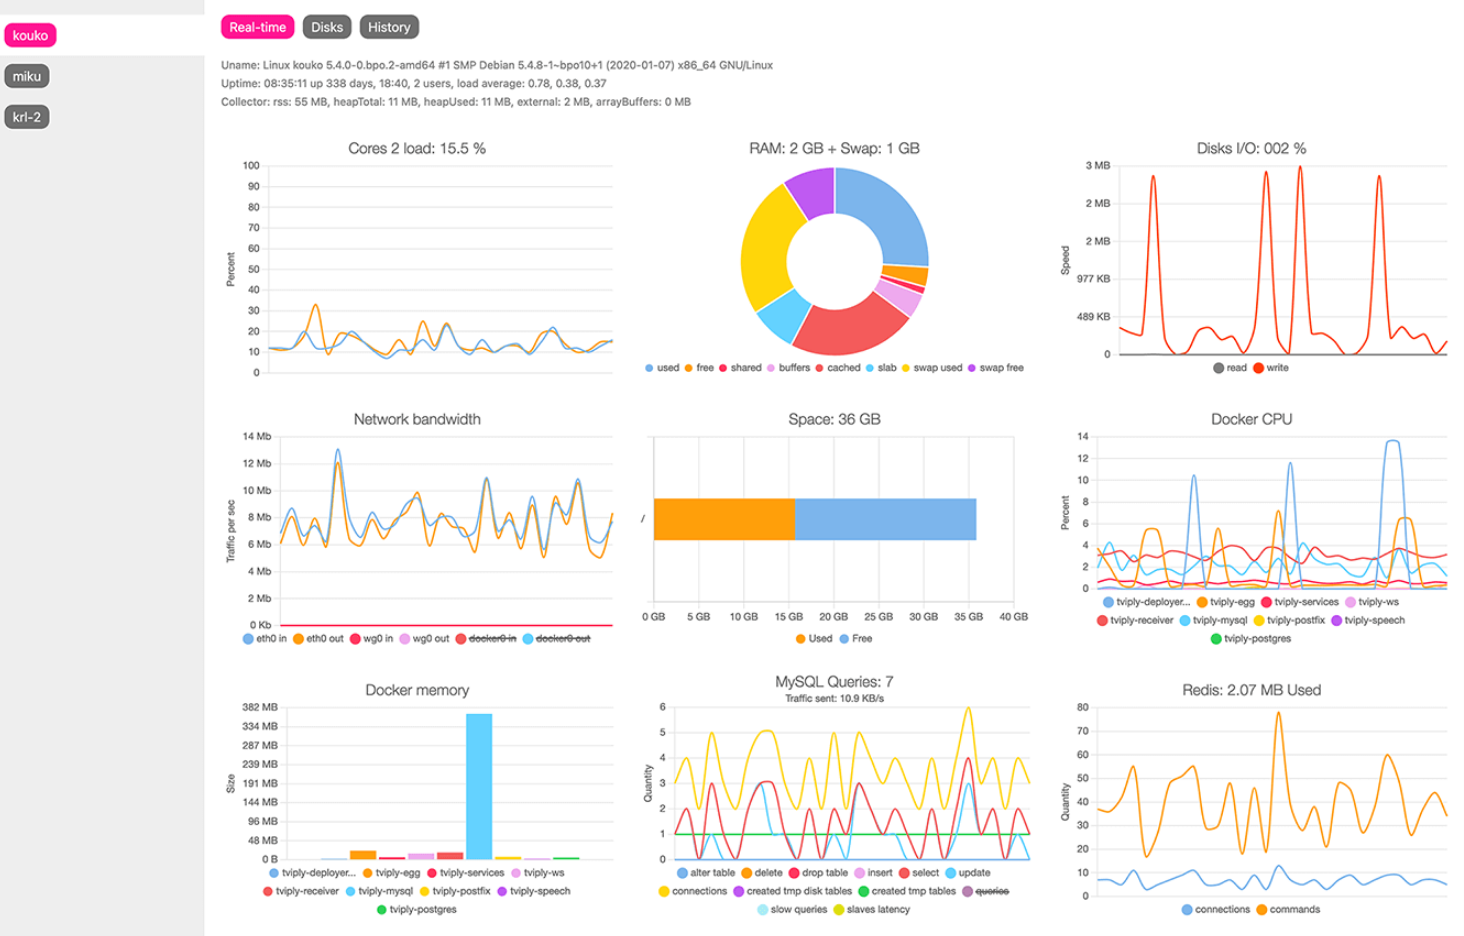
1- Netdata
Netdata is an open-source self-hosted project that enables you to collect metrics per second and presents them in beautiful low-latency dashboards.
It is designed to run on all of your physical and virtual servers, cloud deployments, Kubernetes clusters, and edge/ IoT devices, to monitor your systems, containers, and applications.
It supports several database engines, virtual machines, application metrics and many more.
Hmza Abbas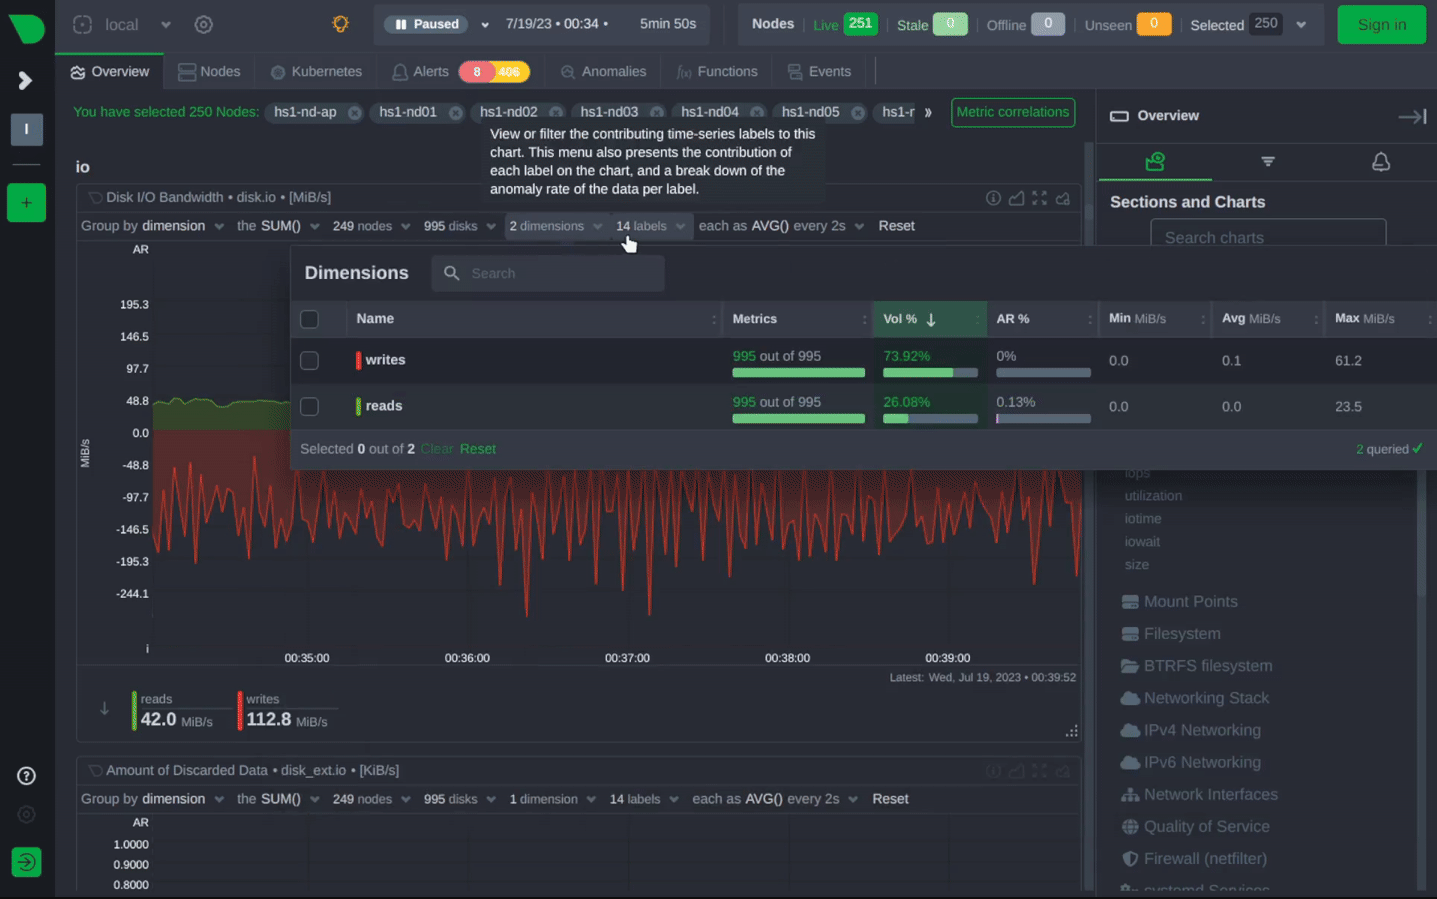
 netdata
2- Swiple
Swiple is an automated data monitoring platform that helps analytics and data engineering teams seamlessly monitor the quality of their data.
With automated data analysis and profiling, scheduling and alerting, teams can resolve data quality issues before they impact mission-critical resources.
Swiple can notify systems admins and teams through email, Slack, Microsoft Teams, OpsGenie, and PagerDuty.
Features
- 📈 Measure the data quality of a SQL query, table, or view.
- 🏗 Generate data expectations using Automated Data Profiling.
- 🕑 Schedule validations to run on any recurrence interval.
- 📄 Automated Data Docs
- 🫡 Add Objectives / SLA's for your data.
- 🔔 Get notified when the quality of your data changes.
Supported Databases
- MySQL
- Athena
- PostgreSQL
- Trino
- Snowflake
- BigQuery
- Redshift
Swiple3- DBA Dash - SQL Server Monitoring Tool
DBA Dash is a tool for SQL Server DBAs that provides assistance with daily checks, performance monitoring, and change tracking.
It offers features such as daily DBA checks, performance monitoring with OS performance counters and custom metrics, tracking configuration changes, monitoring agent jobs, and the option to monitor instances in isolated environments via S3 bucket.
trimble-oss4- Dolphie (MySQL)
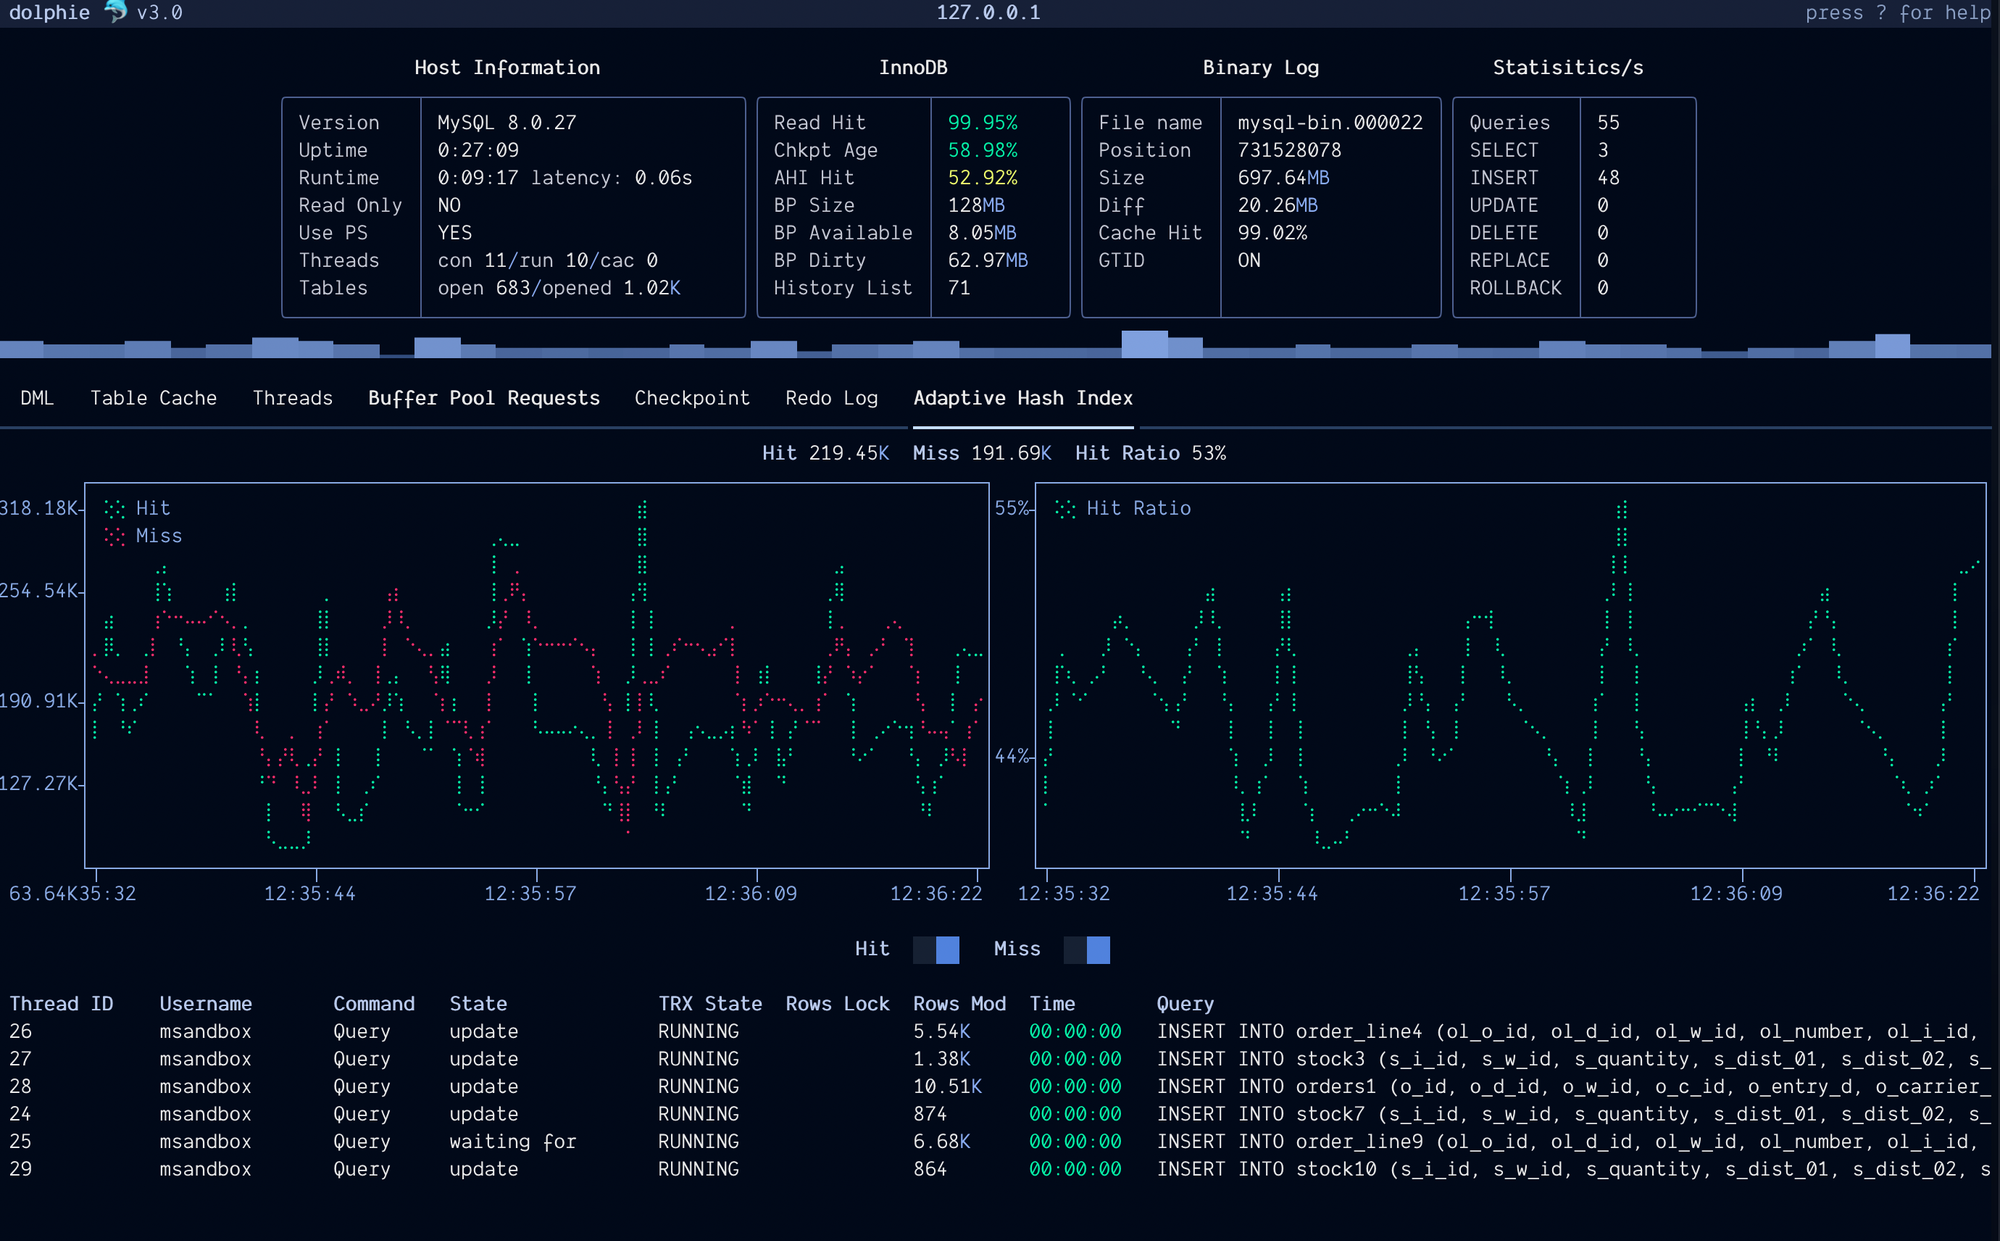
Dolphie is a highly user-friendly and powerful terminal application that provides real-time monitoring capabilities for MySQL.
With its intuitive interface and extensive range of features, Dolphie allows users to effortlessly track and analyze the performance of their MySQL databases.
Whether you need to monitor query execution, analyze server metrics, or identify potential bottlenecks, It has got you covered.
Stay informed and in control of your MySQL environment with the comprehensive monitoring capabilities offered by Dolphie.
Hazem Abbas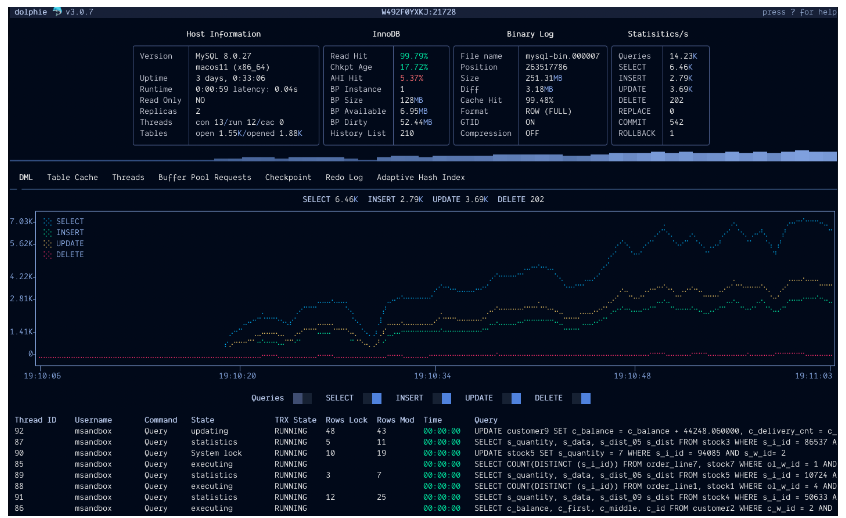 charles-001
5- pgDoctor
pgDoctor is an exceptional open-source solution that delivers a seamless and effortless experience.
It is a free, user-friendly, and nimble web service designed to effortlessly define and execute custom health checks on PostgreSQL instances.
thumbtack6- Anemometer - Box SQL slow query monitor.
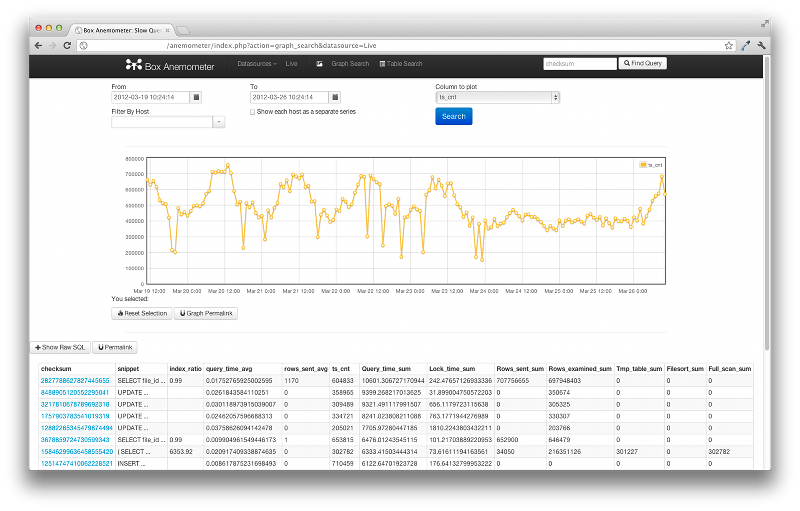
Anemometer is a powerful tool for visualizing collected data from the MySQL Slow Query Log. The name is inspired by the instrument in a weather station that measures wind speed. SQL queries are akin to the wind - elusive and challenging to grasp.
Anemometer empowers you to confidently analyze your queries; it simplifies the process of identifying optimization opportunities and tracking performance trends over time.
Anemometer relies on the Percona Toolkit for efficient slow query log collection. Specifically, you can utilize pt-query-digest to parse your slow logs and seamlessly insert them into a database for comprehensive reporting.
With Anemometer, you can effortlessly generate graphs and statistics that span various time intervals, allowing you to view the corresponding queries within that range.
Furthermore, the intuitive interface enables you to effortlessly zoom in on specific regions of interest by simply clicking and dragging, with the query results dynamically updating in real-time.
This streamlined functionality enables you to swiftly identify performance bottlenecks and gain deeper insights into the exact occurrences during those periods.
box7- pg_Insights
pg_insights is a convenient SQL tool for monitoring the health of a Postgres database. This repository is inspired by commands from Heroku's pg_extras repository.
It provides a collection of SQL queries that are useful for monitoring the health of a Postgres database.
lob8- Blip MySQL Monitor
Blip is a powerful MySQL monitor: it seamlessly collects and accurately reports essential metrics from MySQL to leading monitoring platforms such as Datadog.
It is fully compatible with all vendors and distributions of MySQL 5.7 and 8.0, whether deployed on-premise or in the cloud.
Blip comes with built-in support for popular platforms like Datadog, Splunk, and Chronosphere, and its flexible plugin architecture allows for easy integration with any monitoring platform to ensure comprehensive metric reporting.
cashapp9- Oracle Monitor
Oracle Monitor is a highly useful and efficient free and open-source tool that provides comprehensive monitoring capabilities for Oracle 12c servers. With Oracle Monitor, users can easily keep track of the performance and health of their Oracle 12c servers, ensuring optimal functionality and minimizing downtime.
This tool offers a wide range of features and functionalities, including real-time monitoring of key metrics, proactive alerting and notifications, detailed performance analysis, and customizable dashboards.
vascoalramos10- mysql-statsd
A Python daemon to collect information from MySQL and send it via StatsD to Graphite.
db-art11- Soda Core
Soda Core is an open-source tool and Python library for data quality testing in SQL, Spark, and Pandas.
It allows data quality testing within pipelines and development workflows, and executes checks to identify invalid or unexpected data. Consider using Soda Library for additional features and collaboration with a Soda Cloud account.
sodadata12- Unified Observability for Oracle Database
The Unified Observability for Oracle Database project aims to provide observability for the Oracle Database, offering performance insights and issue diagnosis across applications and databases.
It includes metrics, logging, and tracing support, and integration with frameworks like Spring Boot.
The project supports both cloud and on-premises databases, including those in Kubernetes and containers. The first production release, v1.0, includes a Prometheus exporter based on Seth Miller's work, modified to meet Oracle standards and policies.
Supported Metrics
The following metrics are exposed currently.
- oracledb_exporter_last_scrape_duration_seconds
- oracledb_exporter_last_scrape_error
- oracledb_exporter_scrapes_total
- oracledb_up
- oracledb_activity_execute_count
- oracledb_activity_parse_count_total
- oracledb_activity_user_commits
- oracledb_activity_user_rollbacks
- oracledb_sessions_activity
- oracledb_wait_time_application
- oracledb_wait_time_commit
- oracledb_wait_time_concurrency
- oracledb_wait_time_configuration
- oracledb_wait_time_network
- oracledb_wait_time_other
- oracledb_wait_time_scheduler
- oracledb_wait_time_system_io
- oracledb_wait_time_user_io
- oracledb_tablespace_bytes
- oracledb_tablespace_max_bytes
- oracledb_tablespace_free
- oracledb_tablespace_used_percent
- oracledb_process_count
- oracledb_resource_current_utilization
- oracledb_resource_limit_value
oracle13- pgDoctor
pgDoctor is a straightforward, lightweight, open-source web service that enables you to define and execute custom health checks on PostgreSQL instances without any cost.
thumbtack14- pg-Index-Health-SQL
pg-index-health-sql is a collection of SQL queries for analyzing and maintaining the health of indexes and tables in Postgresql databases.
It helps detect various problems such as invalid, duplicated, intersected, and unused indexes, foreign keys without associated indexes, indexes with null values, tables with missing indexes or without a primary key, index and table bloat, tables and columns without descriptions, columns with JSON type, and non-primary key columns with serial types.
It can be installed easily using Docker.
mfvanek15- Posemo PostgreSQL Secure Monitoring
Posemo is a PostgreSQL monitoring framework that follows the guidelines of the German Federal Office for Information Security (BSI). It allows monitoring of PostgreSQL servers without accessing the data.
Posemo is modular and can provide results for different monitoring environments. New checks can be easily added by writing SQL and configuring them.
The framework generates PostgreSQL functions for each check, which are executed by an unprivileged user with elevated privileges. This approach ensures that the monitoring server does not need access to databases or PostgreSQL internals, and only requires the ability to call predefined functions.
alvar-freude16- Statsender (PostgreSQL)
statsender is a powerful and reliable open-source tool that efficiently collects and sends out a comprehensive range of PostgreSQL server statistics.
With its seamless integration with pgmeter, statsender offers a complete end-to-end monitoring solution for distributed PostgreSQL databases, ensuring you have full visibility and control over your database performance and health.
vynaloze17- Highload Stats
HGLS Statistics provides real-time graphs and historical stats on servers. It is an easy and powerful tool that can monitor your server, database engines, and more.
oxmix18- GaleraMonitoring (MySQL)
Golang cluster offers MariaDB/ MySQL monitoring with slack alerting.
Kaderovski-zz19- mysql-monitor
MySQL server monitoring script for real-time SMS status updates.
The script will try to connect to the database at regular intervals and sends a text message to the admin if the connection fails.
cjdm9420- Mysql Monitor
This tool is basically Atop with some mysql queries included such as:
- Process list
- Threads
- Engine innodb status
- Slave status
Which can be either saved inside a slqite3 db(experimental) (Some features here are still missing, e.g export from sqite to file). Or to .json.gz/.txt.gz files on disk.
messagebird21- mongodb-monitoring
A very simple monitoring for MongoDB clusters.
- Reads
config.yaml - Discovers topology via
rs.config() - Pings every member
- Reports back to SignalFx as
mongodb.upwithhostdimension
ceecko22- MySQLTuner-perl
A script that allows you to review a MySQL installation quickly and make adjustments to increase performance and stability.
major23- pstop
a top-like program for MySQL, collecting, aggregating and displaying information from performance schema.
sjmudd