CBoard Is an Open-source Self-hosted Business intelligence Reporting and Dashboard

CBoard is a highly versatile analysis platform that provides a plethora of features to users who are looking to improve their data analysis capabilities. It is an interactive platform that allows users to design multi-dimensional reports with ease. Not only is it beneficial for normal users, but it is also a great BI product development platform for developers. CBoard is supported by Shanghai Chuguo Information and Technology Co., Ltd..
With CBoard, normal users are empowered to analyze their data and design reports with just a few simple drag-and-drop operations. The platform offers an intuitive interface that makes it easy for users to understand and use. Developers can also leverage the platform to extend any type of data source by connecting to it through a Java program.
Architecture
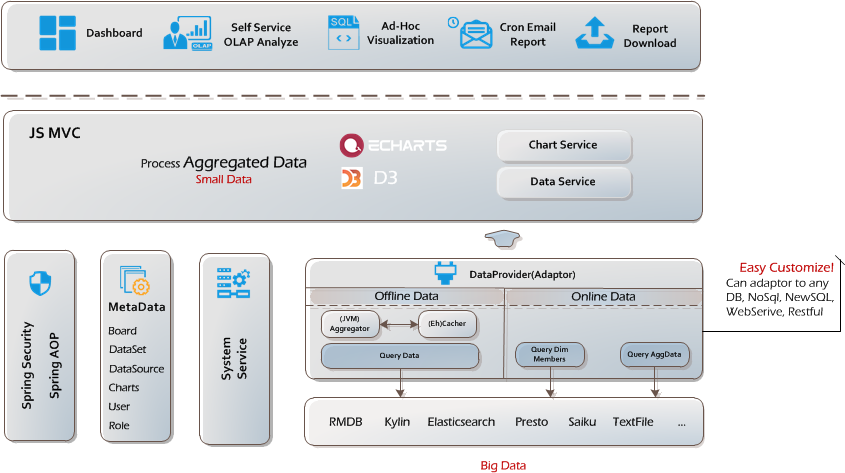
CBoard has a unique lightweight architecture that provides a fast and efficient analysis experience for its users. The platform is built on a common technology stack and features a self-designed multi-dimensional engine that optimizes query performance. Additionally, the platform has clear optimization rules that ensure it runs efficiently on big data stacks. Overall, CBoard is a powerful tool that provides users with the ability to gain valuable insights from their data.
Features
- Simple and beautiful interface and layout
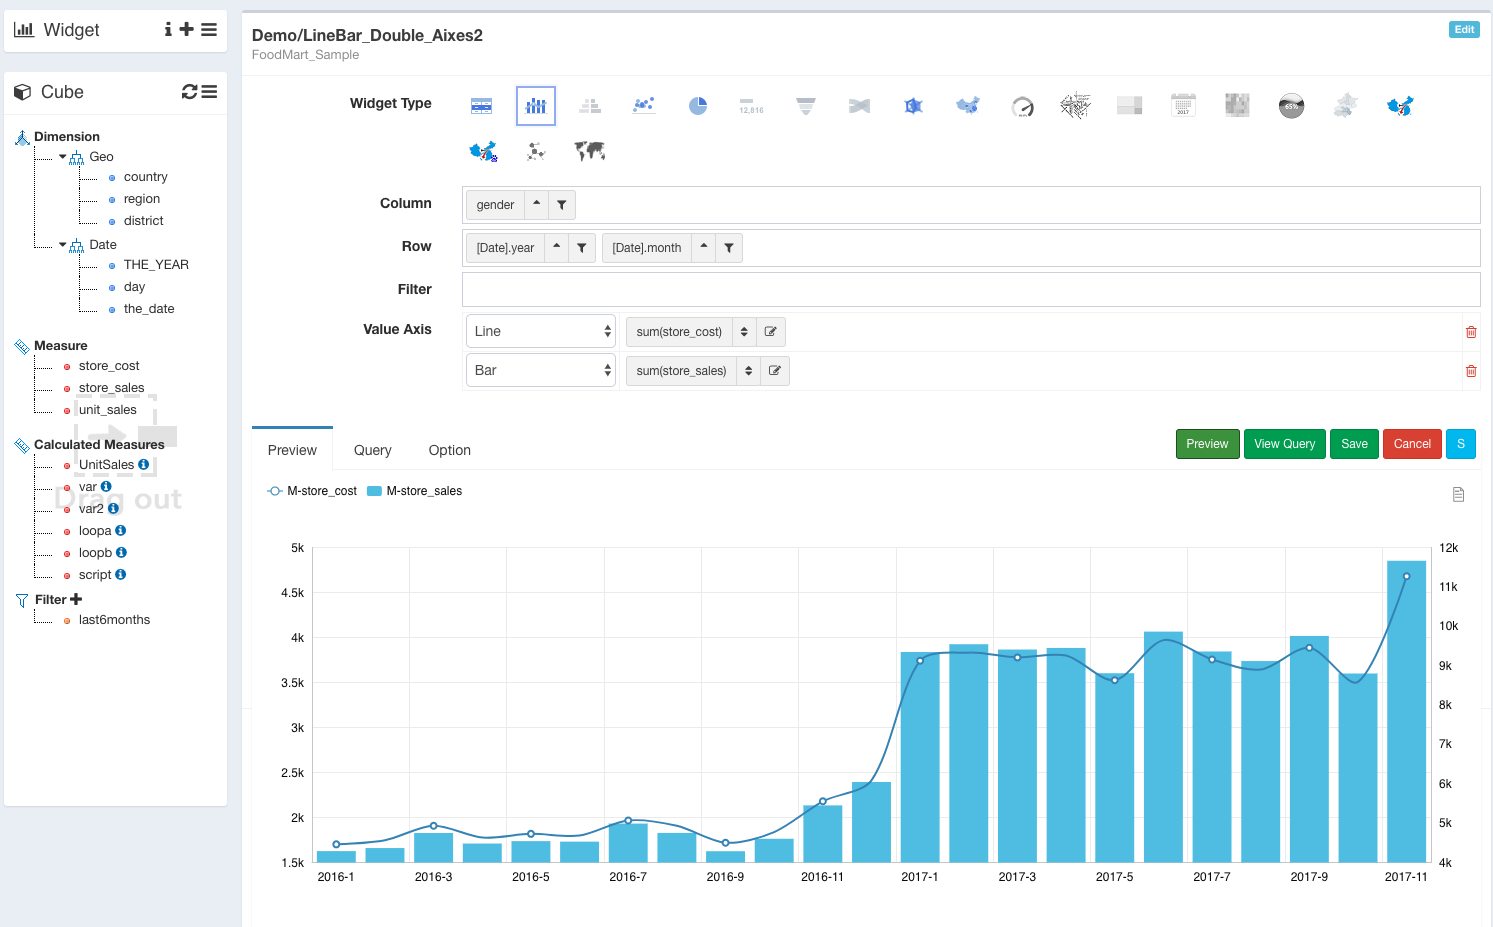
- Interactive, drag-and-drop OLAP classic report development experience
- One dataset, multiple report widgets. Maximize reuse query result
- Cube level data refresh / real-time chart for quick query
- Role Based Access Control
- More than 20 chart types and dashboard insight or email report
- Multiple types of data source connection
- Support JDBC data connection (Almost all kinds' database that has implemented JDBC protocol)
- Support Native Elasticsearch connection for version 1.x, 2.x, 5.x
- Support Native Kylin connection for version 1.6
- Lightweight architecture and concise source code, the entire project does not rely on any third-party multidimensional analysis tools, if you are struggling in Mondrain, CBoard could be a nice alternative for you.
- Easy to implement your own DataProvider to connect any data source. Even for expensive commercial BI suite, it's not possible to connect all the NoSQL and NewSQL data source in the era of big data. Due to the schema of NoSQL are various, such as hash tables, arrays, trees, maps, etc., different people using the same NoSQL product's designed Schema may vary widely. The user who most familiar with their storage schema are the user themselves. And it's easy to find a Java programmers to code a Class to connect their own data source. So we leave this part of the work to the end user with an easy extended data connection framework in CBoard.
Community Edition V.S. Enterprise Edition
| Features | Community Edition | Enterprise Edition |
|---|---|---|
| Multiple kinds of data source plugins | :white_check_mark: | :white_check_mark: |
| Drag-and-drop self-service multidimensional analysis | :white_check_mark: | :white_check_mark: |
| More than 20 kinds of chart type | :white_check_mark: | :white_check_mark: + 明细表 + GIS中国地图 |
| Dashboard | :white_check_mark: | :white_check_mark: |
| Near-realtime data refresh | :white_check_mark: | :white_check_mark: |
| Dashboard Layout | Layout by row and column, view and design are seperated | Free layout and live preview |
| Dashboard parameter | Common filter | Add date range filter, checkbox, searchable dropdown selector filter, keyword input filter |
| Cockpit Dashboard | :x: | :white_check_mark: |
| Chart link | Design for developers, simple support based on raw data columns | Design for data analyst, complete chart linkage mechanism to support linkage to datasets, billboards |
| Inline chart | :x: All charts must first be saved and managed in the Widget Config design area. | Support insert inline chart in dashboard. |
| Send report email | :white_check_mark: | :white_check_mark: |
| Regroup dimension members | :x: | :white_check_mark: |
| Cusomize sort dimension members | :x: | :white_check_mark: |
| Chart tunning | Simple supported | More powerful and easy to use |
| Detail data table | :x: | :white_check_mark: |
| GIS Map chart on detail data | :x: | :white_check_mark: |
| Data Security | Chart level Control | :star::star: Data cell level control and support role based data access control |
| Folder based resource managment system | :x: Only support virtual path based folder | OS likly file system solution. ACL can be managed by folder |
| Advantage Cross Table | :x: | :star::star: Supports advanced calculations such as year-on-year, aspect ratio, percentage, totals, subtotals, cell conditional styles |
| Dashboard iframe integeration | :x: | Iframe external system integration with parameter control |
| SDK integeration Support | :x: | :white_check_mark: |
| Front-end Technology Stack | AngularJS | VueJS + ES6 + Webpack |
| Professional Technology Support | :x: | :white_check_mark: Escort your production environment |
| Road Map | :x: Maintenance-oriented | Customer-oriented Road map |
License
Apache-2.0 License
Tech
- JavaScript