Grafana Pyroscope is a Continuous Profiling Platform (Free & Open-source)

What Is Grafana Pyroscope? A Simple Guide to Continuous Profiling
If you're running applications in production and want to optimize performance, reduce CPU usage, or fix slow response times, Grafana Pyroscope is a must-have tool.
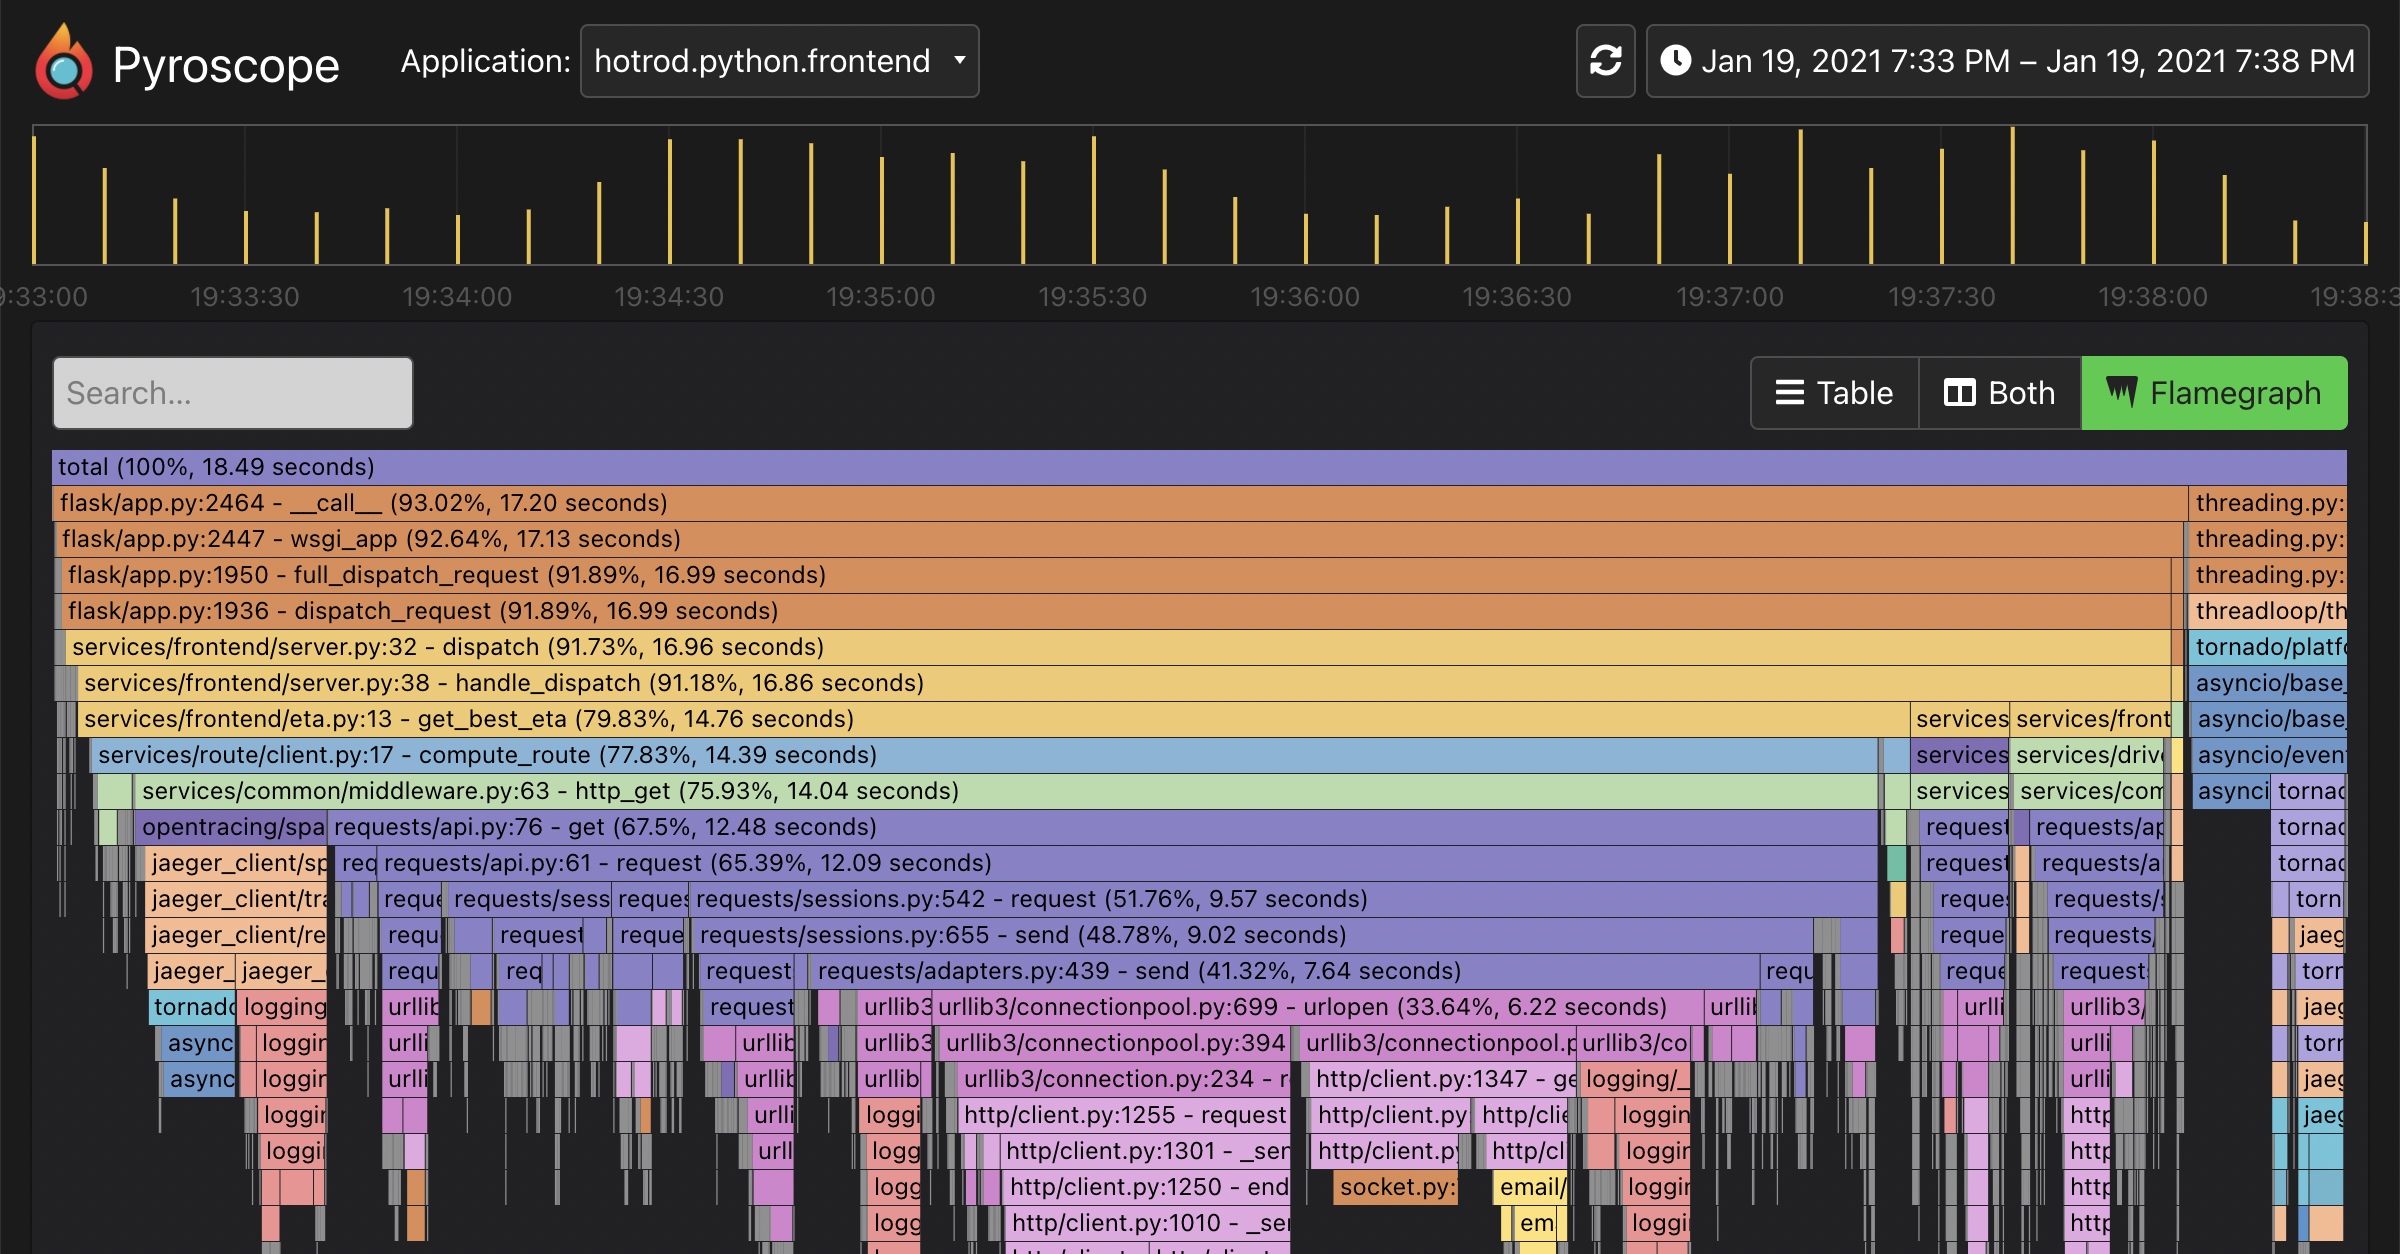
Pyroscope is a continuous profiling platform that helps you see exactly where your app spends time, down to individual code lines. It tracks real-time data on CPU, memory, and I/O usage across your services, so you can spot inefficiencies before they become problems.
And the good news, it works on Linux, macOS, and can even be installed using Docker.

Why Use Grafana Pyroscope?
- Find performance bottlenecks fast: See which functions are consuming the most CPU or memory.
- Prevent latency issues: Analyze trends over time to catch slowdowns early.
- Debug live incidents quickly: When something breaks, get line-level insights without restarting or adding logs.
- Integrate with Grafana: Visualize profiling data alongside metrics, logs, and traces for full-stack observability.
It’s perfect for teams using microservices, Kubernetes, or cloud-native apps who want to improve system efficiency, cut costs, and deliver faster experiences.
Pyroscope works with Go, Java, Python, Node.js, and more. No need to change your code, just add the agent, and start profiling.
Pyroscope Components
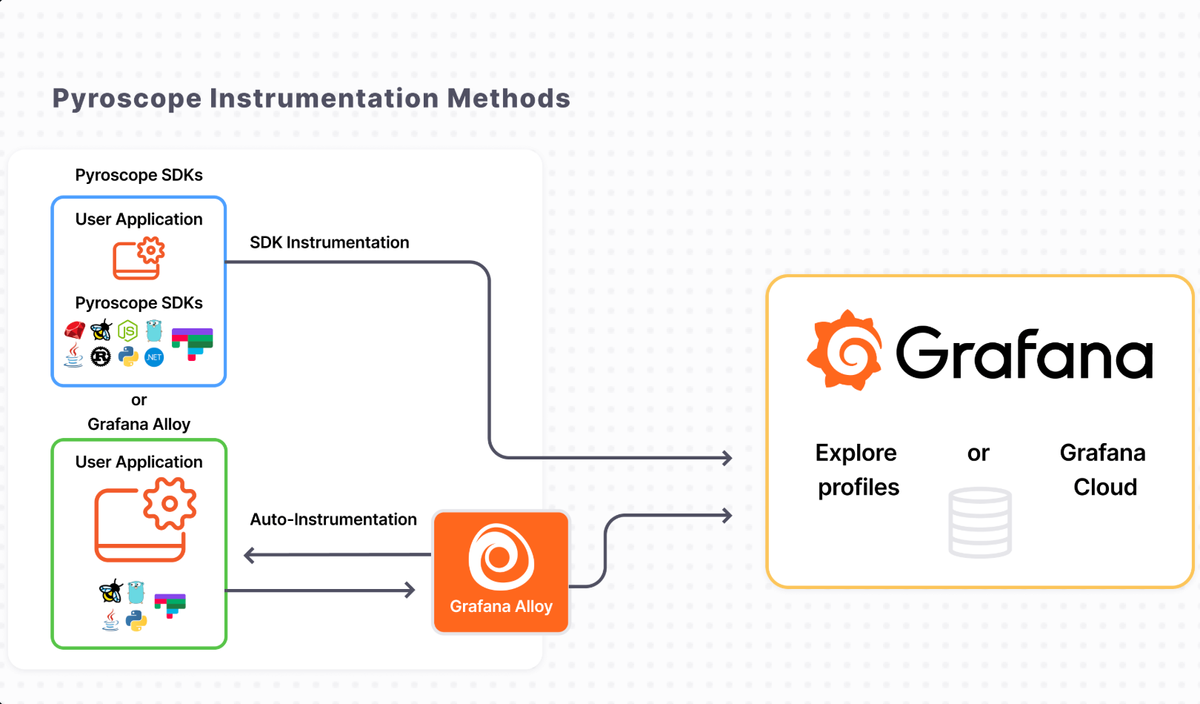
Pyroscope consists of three main components:
- Pyroscope Server: The server component that stores and processes profiling data.
- Pyroscope SDKs(push) or Grafana alloy(pull) : The client-side part of Pyroscope that collects profiling data from your applications and sends it to the server.
- Explore Profiles UI: A query-less, intuitive UI for visualizing and analyzing profiling data.
History
Grafana Pyroscope was created by merging two open-source continuous profiling projects: Phlare (by Grafana Labs, launched 2022) and Pyroscope (founded by Ryan Perry and Dmitry Filimonov, 2021).
The goal is to provide scalable, open-source continuous profiling at scale, giving developers deep insights into their application’s CPU, memory, and I/O usage.
By identifying performance bottlenecks down to the code level, Pyroscope helps teams optimize app performance and reduce infrastructure costs, empowering smarter, more efficient software development.
Who Needs Grafana Pyroscope, And Why?
Grafana Pyroscope isn’t for everyone, but it’s essential for teams who care about real performance, efficiency, and system stability.
Here’s exactly who benefits, and why:
1. Backend & Cloud Engineers
Why they need it? You’re running microservices in Kubernetes or the cloud. Your app is slow, but logs don’t show why. CPU usage spikes at random times.
Pyroscope gives you line-by-line visibility into what’s consuming CPU or memory, no more guessing. You can fix hot functions before users notice.
Use case: A Go service suddenly uses 90% CPU during peak hours. Pyroscope shows it’s a single function in a loop with inefficient string handling. Fix it in minutes.
2. DevOps & SRE Teams
Let's say that you a part of a DevOp or SRE team, then You’re responsible for uptime, latency, and cost. Unoptimized code = wasted resources = higher cloud bills.
With Pyroscope, you can identify resource hogs, reduce over-provisioning, and optimize infrastructure costs.
Use case: A Python backend runs on 4 vCPUs but only needs 1. Pyroscope reveals a memory leak in a third-party library. Downsize the instance, save $300/month.
3. Full-Stack Developers Building Scalable Apps
Why they need it:
You’ve shipped features, but performance has degraded. You want to ship fast, but not at the cost of speed. Pyroscope helps you catch regressions early, especially when adding new logic or dependencies.
Use case: After updating a library, your API response time jumps from 100ms to 800ms. Pyroscope pinpoints the culprit: a poorly optimized JSON parser.
4. Teams Using Microservices or Serverless
Why they need it:
In complex architectures, it’s hard to trace where delays happen. One slow service can bring down the whole system. Pyroscope provides cross-service profiling, so you see how each component behaves under load, without changing your observability stack.
Use case: An AWS Lambda function triggers a chain of services. One step takes 3 seconds. Pyroscope shows it’s not the function—it’s a sync call in a dependency.
5. Startups & Growing Companies
You’re scaling fast but want to avoid technical debt. You don’t want to pay for servers you don’t need. Pyroscope helps you build efficiently from day one, reduce waste, and keep your app responsive as traffic grows.
Use case: A startup sees high cloud costs after launch. Pyroscope finds three inefficient database queries. Optimizing them cuts costs by 40%.
In the end, You need Grafana Pyroscope if:
- You want to reduce CPU/memory usage.
- You’re dealing with unexplained latency or crashes.
- You want to debug live issues faster.
- You’re serious about building performant, cost-efficient software.
It’s not just a tool, it’s a way to turn invisible performance problems into clear, actionable fixes.
For engineers who care about code quality, system health, and real-world impact, Pyroscope isn’t optional. It’s foundational.
Install it using Homebrew on macOS
You can easily install it on your macOS using the following command:
brew install pyroscope-io/brew/pyroscope
brew services start pyroscope
Install using Docker
To install it using Docker, all you need is to have Docker installed at your system then run the following command in your terminal:
docker run -it -p 4040:4040 grafana/pyroscopeBy then head to your local host and type: http://localhost:4040/
Supported Languages
- Go language
- Java
- Ruby
- Node.js
- Rust
- .Net
- eBPF
License
Grafana Pyroscope is a free and open-source project that is released under the AGPL-3.0 License.
Resources & Downloads