Plots is an open-source, free app to visualize visualize mathematical formulas

What is Plots?
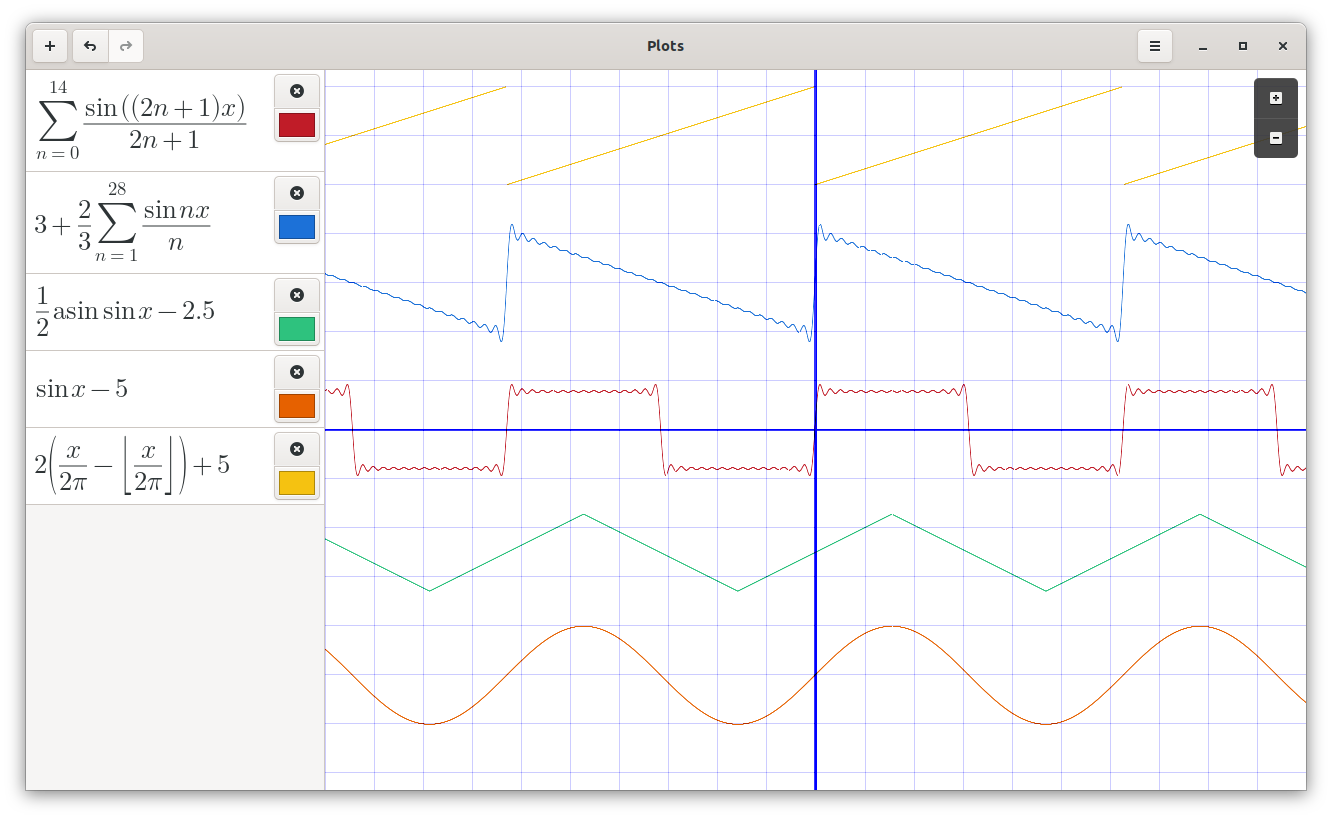
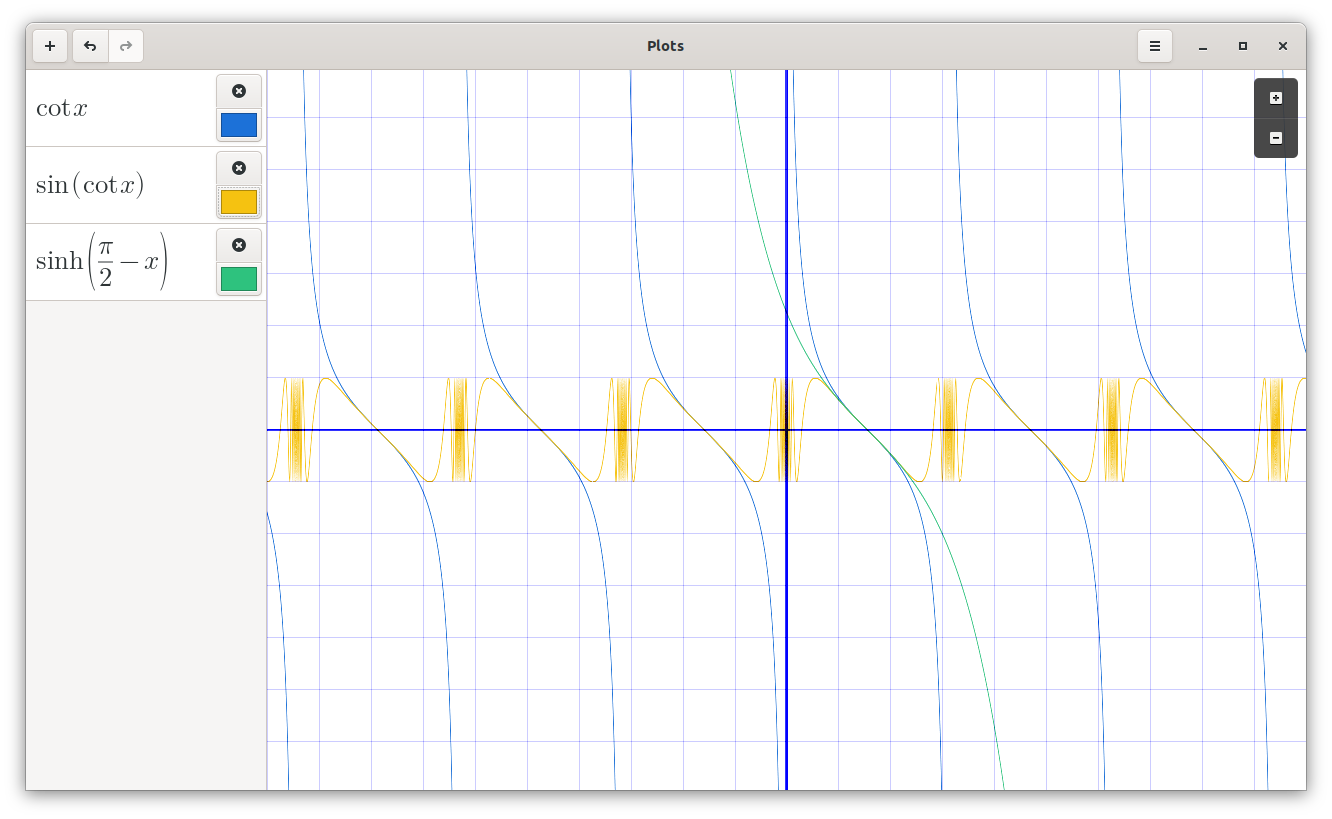
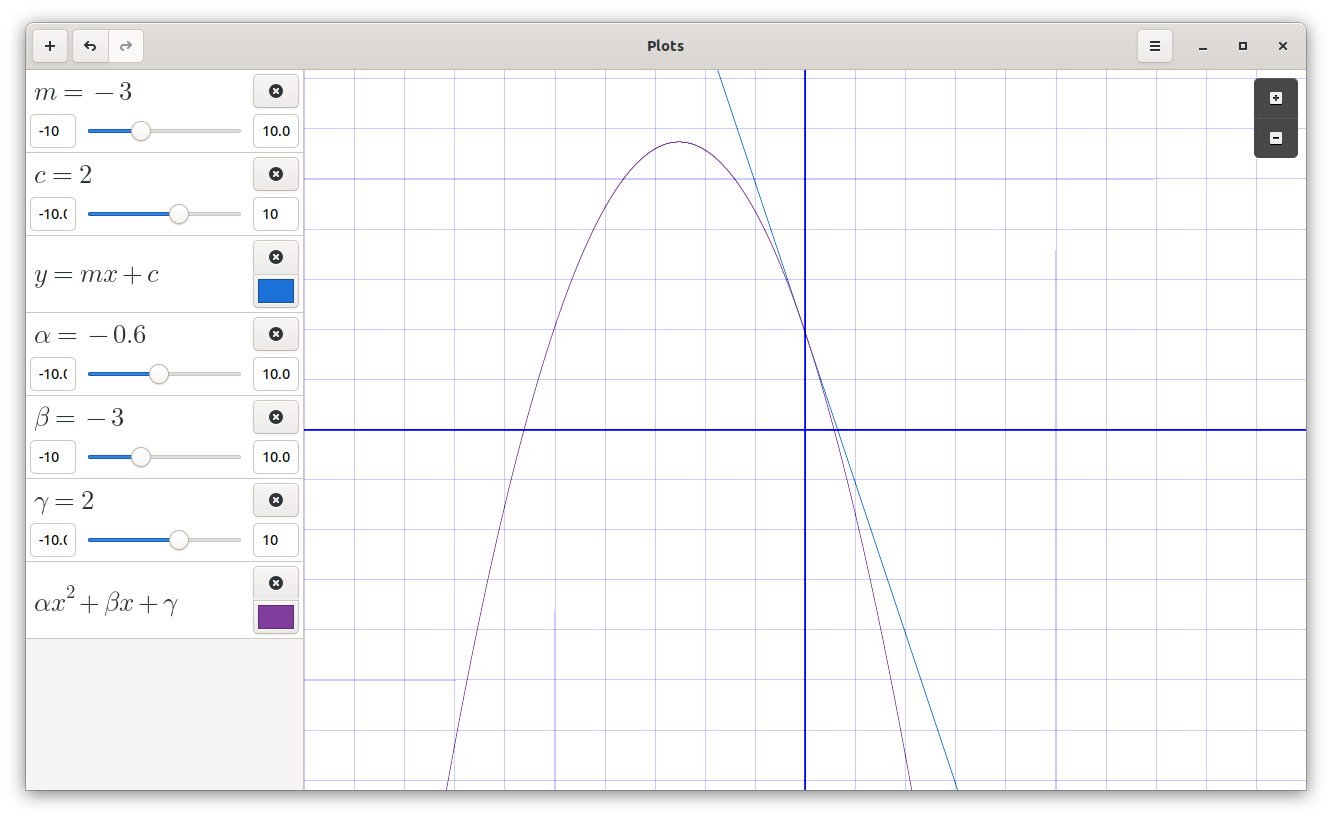
Plots is a graph plotting app for GNOME. Plots makes it easy to visualize mathematical formulae. In addition to basic arithmetic operations, it supports trigonometric, hyperbolic, exponential and logarithmic functions, as well as arbitrary sums and products. It can display polar equations, and both implicit and explicit Cartesian equations.
Plots is created by Alex Huntley.
Platforms
Plots is designed to integrate well with the GNOME desktop and takes advantage of modern hardware using OpenGL.
It offers an Ubuntu, Debian, Linux Mint and Arch Linux packages, which can be installed easily through the built-in repo package manager.
You can install it through Flatpak as well using Flathub repo, by just running this command:
flatpak install flathub com.github.alexhuntley.PlotsTo run it from source with Python, simply clone the repo and run:
python3 -m plotsScreenshots

License
Plots is released under GPL-3.0 License.