RATH is an Open-source, Self-hosted Platform for Data Exploration, Visualization, and Analysis


RATH is not only an open-source alternative to data analysis and visualization tools like Tableau, but it goes beyond that. It revolutionizes the exploratory data analysis workflow by leveraging its augmented analytic engine to automatically uncover patterns, insights, and causal relationships.
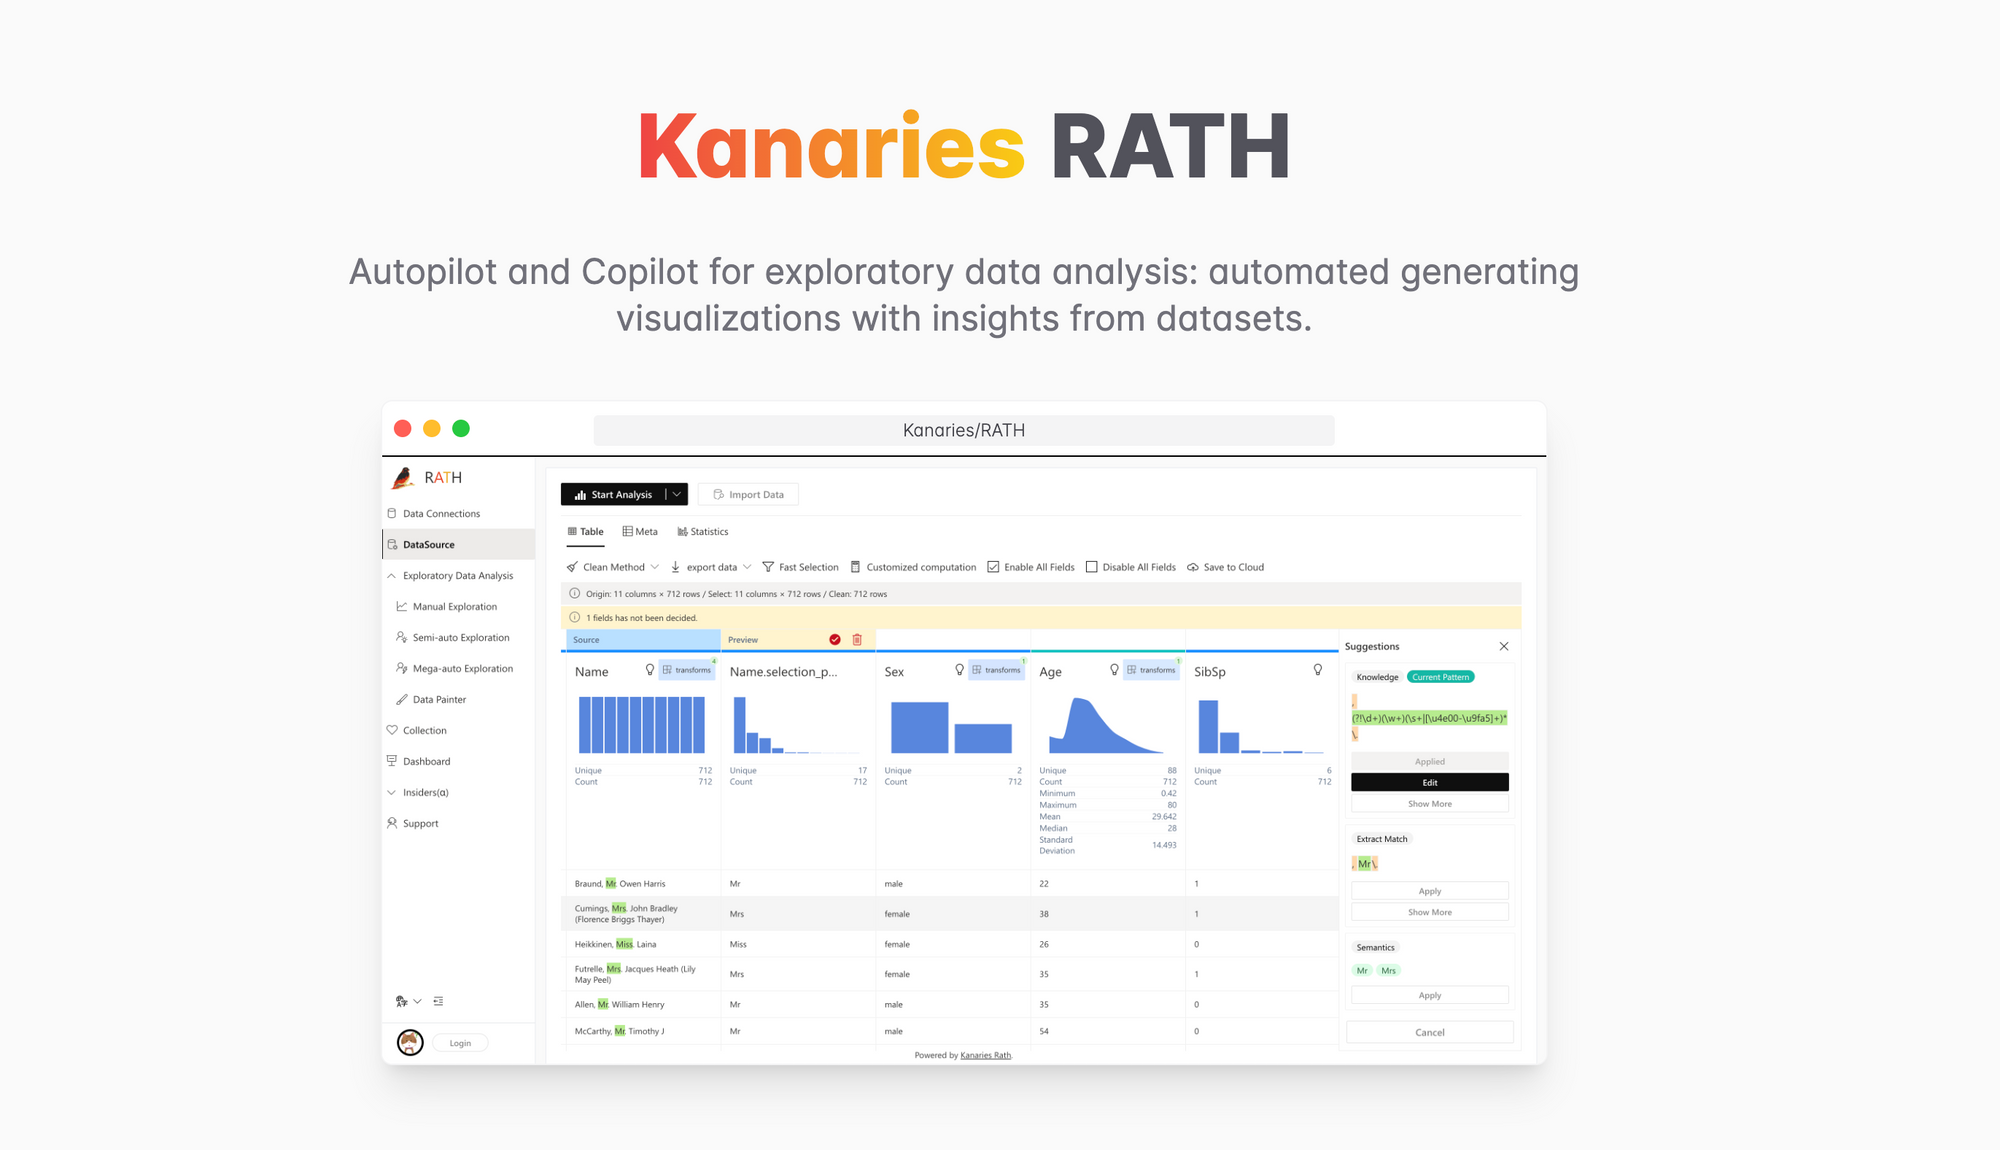
Moreover, it takes these discoveries a step further by presenting them through visually stunning multi-dimensional data visualizations that are generated automatically. With its cutting-edge technology, RATH sets the bar for the future of automated data exploratory analysis and visualization platforms.
Features
- 🤖 AutoPilot for Data Exploration: Get Insights with One Click! Augmented analytic engine for discovering patterns, insights, and causals. A fully-automated way to explore and visualize dataset with one click.
- 🛠 Copilot for Data Exploration: RATH will work as your copilot in data science, learn your intends and generate relevant recommendations.
- Natural Language interface: Ask questions in natural language to get answers/visualizations from your data.
- AutoVis: RATH will generate the best visualization for the data you selected. It makes you focus on data and variables, not how to make a visualization.
- 👓 Data Wrangler: Automated data wrangler for generating summary of the data and data transformation.
- 🎨 Data Painter: An interactive, instinctive yet powerful tool for exploratory data analysis by directly coloring your data, with further analytical features. Watch this video demonstrating about how to discover data insights with Data Painter.
- 📊 Dashboard: Build a beautiful interactive data dashboard (including a automated dashboard designer which can provide suggestions to your dashboard).
- Causal Analysis: Identify and examine the causal relationship between variables, which can help explore the data, create better prediction models and make business decission.
- One-click automated data analysis with visualizations:
Augmented analytic engine for discovering patterns, insights, and causals. A fully-automated way to explore and visualize dataset with one click. - Manually explore your data with drag and drop
- Import/ Export data as CSV, and JSON.
Casual Analysis
Causal analysis could be defined as the way to identify and examine the causal relationship between variables, which can help explore the data, create better prediction models and make business decision.
RATH's causal analysis feature include:
- Causal Discovery
- Editable graphical causal models
- Causal interpretability
- Interactive tools for deeper exploration
- What-if analysis
Supported Databases
RATH supports a wide range of data sources. Here are some of the major database solutions that you can connect to RATH:
- HIVE
- PostgreSQL
- Cloudera Impala
- Airtable
- Oracle
License
Rath is an automated data analysis and visualization tool (auto-EDA). It is a free and open-source software licensed under the AGPL.
Resources
 Kanaries