SciDAVis is an open-source application for scientific data analysis and data visualization

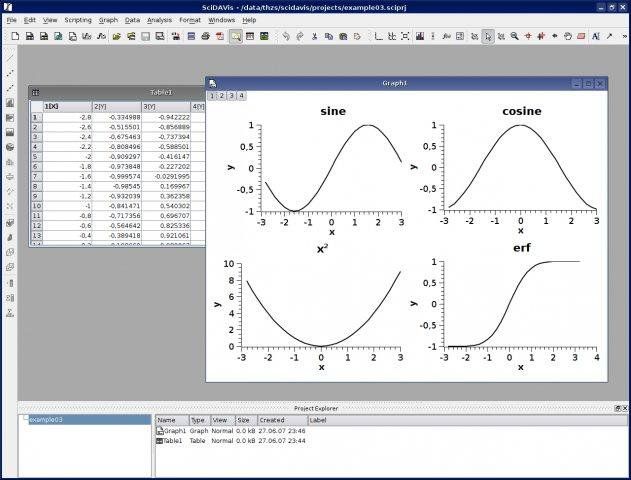
SciDAVis is a free interactive application aimed at data analysis and publication-quality plotting. It combines a shallow learning curve and an intuitive, easy-to-use graphical user interface with powerful features such as scriptability and extensibility.
Alternative to:
SciDAVis is similar in its field of application to proprietary Windows applications like Origin and SigmaPlot as well as free applications like QtiPlot, Labplot, and Gnuplot.
What sets SciDAVis apart from the above is its emphasis on providing a friendly and open environment (in the software as well as the project) for new and experienced users alike.
Features
- It features a 2D tables' data viewer
- Supports 3D metrics
- Includes 2D and 3D plots
- The data can be imported or added directly from ASCII files
- Supports special functions and formulas
- Extensive support for fitting linear and nonlinear functions to the data, including multi-peak fitting.
- Publication-quality 2D plots of various types including symbols/lines, bars, and pie charts which can be exported to a variety of formats (JPG, PNG, EPS, PDF, SVG, and more)
- Interactive 3D plots with export to a variety of formats, including EPS and PDF.
- Note windows with support for in-place evaluation of mathematical expressions. With Python installed, you can even access other objects in the project, e.g., for rapidly writing an import filter for a custom data format.
Platforms
SciDAVis runs on GNU/Linux, Windows, and macOS; possibly also on other platforms like *BSD, although this is untested.
License
SciDAVis is released under the GPL-2.0 license.