
data engineering
DIVA: Empowering Secure and Compliant Data Sharing in the Digital Age
Exploring DIVA: A Deep Dive into Secure and Privacy-Aware Data Usage
Open-source data science application

data engineering
Exploring DIVA: A Deep Dive into Secure and Privacy-Aware Data Usage
Jupyter
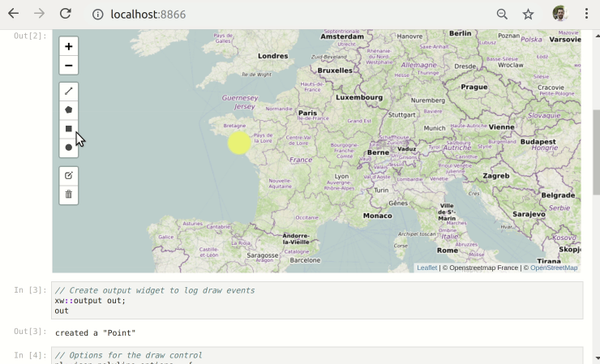
Voila is an open-source tool that converts Jupyter notebooks into interactive dashboards and web applications. It allows users to create dynamic interfaces using ipywidgets without needing front-end development skills. Voila executes code server-side, providing secure interactions with output only. It is compatible with JupyterHub, it supports multi-user environments and can

List
What is a Data warehouse Solution? A data warehouse solution is a centralized repository designed for the storage, analysis, and retrieval of large volumes of structured and unstructured data from multiple sources. It consolidates data from various operational systems, transforming it into a unified format to support business intelligence activities,
data science
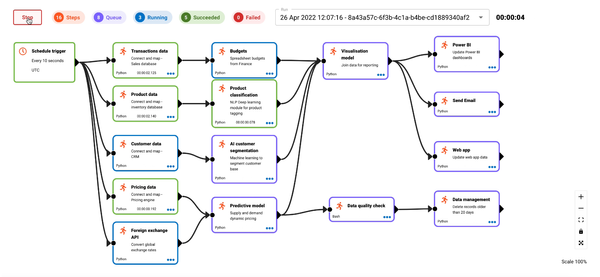
What is DataPlane? DataPlane is a high-performance software written in Golang, featuring a drag-drop data pipeline builder, built-in Python code editor, granular permissions for team collaboration, secrets management, a scheduler with multiple time zone support, and isolated environments for development, testing, and deployment. It also allows monitoring of real-time resource
data science
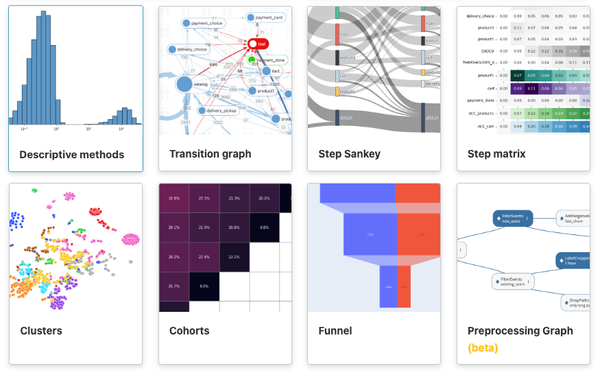
Welcome to our article about the best open-source self-hosted tools for data scientist and engineers. In this fascinating world of data, having the right tools at your disposal is crucial. From data cleaning to visualization, these open-source tools can make your life easier and enhance your workflow. 10 Reasons Why
data science
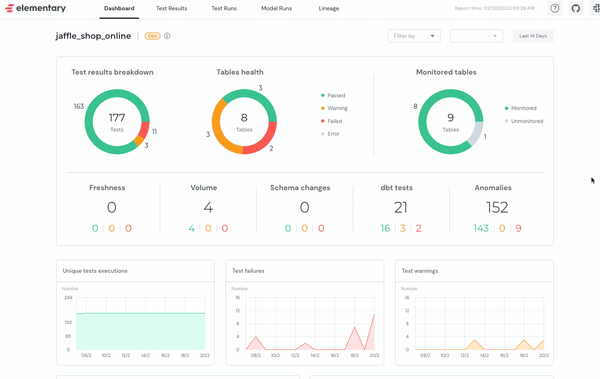
If you're a data engineer or data scientist, you understand the importance of a robust data observability tool. Enter Elementary, a native data observability solution designed specifically for data and analytics engineers. It's not just a tool, it's a comprehensive platform that integrates seamlessly
data science
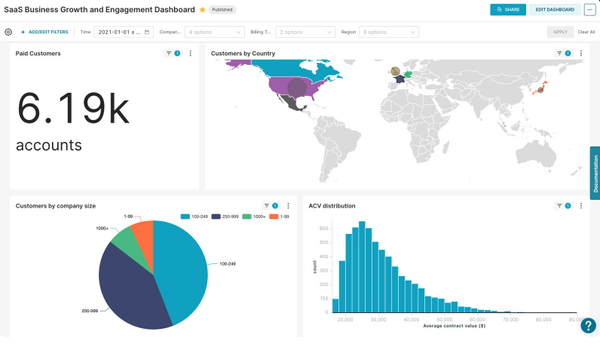
Apache Superset stands as a premier open-source data exploration and visualization platform, ingeniously designed to facilitate the creation of dynamic, insightful dashboards. It is a must-have tool for data scientists, data engineers, teams and business intelligence experts. Built for Data Exploration It effortlessly empowers users to navigate data from diverse

data science
Unveiling the Essence of Data Science

data engineering
Dubai's Digital Transformation: Pioneering the Future with Automation and Data Engineering
data science
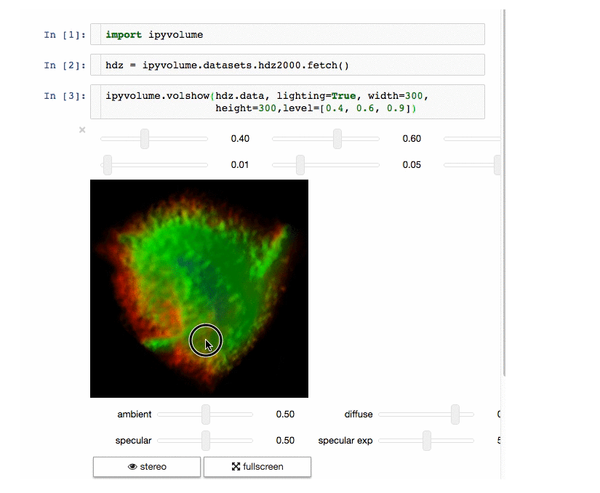
What is Ipyvolume? Ipyvolume is an innovative application designed for 3D plotting in Python, specifically within the Jupyter notebook environment. Using WebGL and IPython widgets, it provides a robust platform for visualizing complex data in three dimensions. Its capabilities include volume rendering, scatter plots, quiver plots, isosurface rendering, and lasso
List
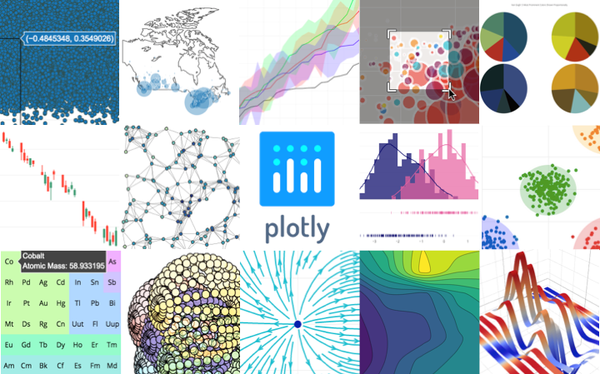
Welcome to an exhaustive list of over 30 data visualization libraries, frameworks, and applications. These tools span across a myriad of platforms and programming languages, providing you with the capability to present complex data in visually appealing and accessible ways. These solutions cater to a wide range of needs, whether
Self-hosted
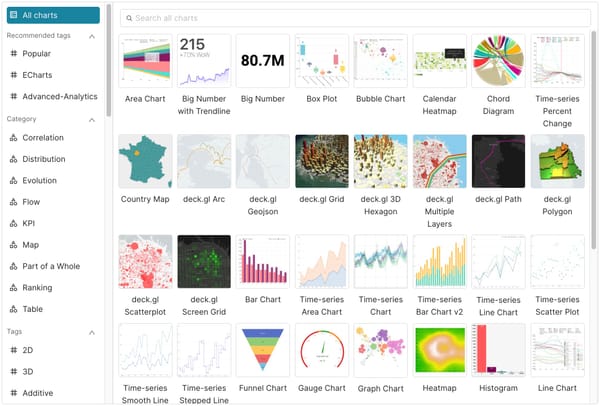
Apache Superset™ is an open-source modern data exploration and visualization platform.
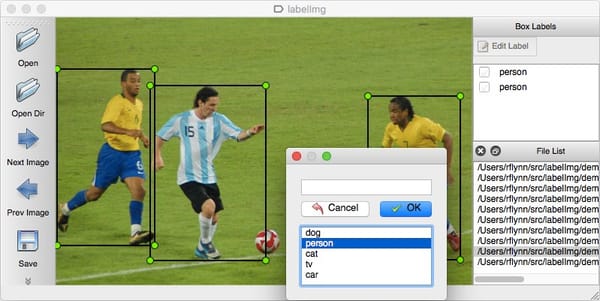
Artificial Intelligence (AI)
What is Image annotation and labeling? Image annotation and labeling involves adding metadata to images, such as tags or notes, to provide additional context or meaning. This process is crucial in various fields, particularly in machine learning and artificial intelligence (AI), where it helps in training models to recognize and
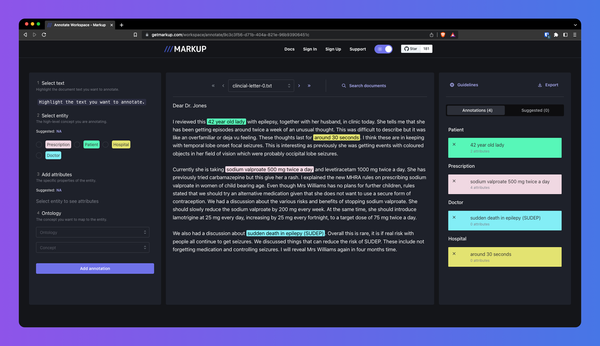
Artificial Intelligence (AI)
What is Text annotation? Text annotation is the process of associating labels or tags to specific parts of a text, such as phrases, words, or sentences. The aim is to provide additional information about the text, which can then be used for further analysis or processing, particularly in the field

Scrapping
news-please is an open-source news crawler that extracts structured information from news websites. It uses libraries like scrapy, Newspaper, and readability, and can follow internal hyperlinks and read RSS feeds to fetch both recent and archived articles. It also features a library mode for Python developers and can extract articles