Top 30 Free Apps for Flawless Website Uptime and Server Health Checks


Welcome to our comprehensive guide on the Top 30 Solutions for Flawless Website Uptime and Server Health Checks. In the digital age, maintaining the operational health of your website and servers is fundamental.
Downtime can lead to lost revenue, reduced customer trust, and negative impacts on your search engine rankings. This guide presents a variety of tools and services that will help you monitor your website uptime and server health, ensuring that your digital assets are always running smoothly and efficiently.
Tianji
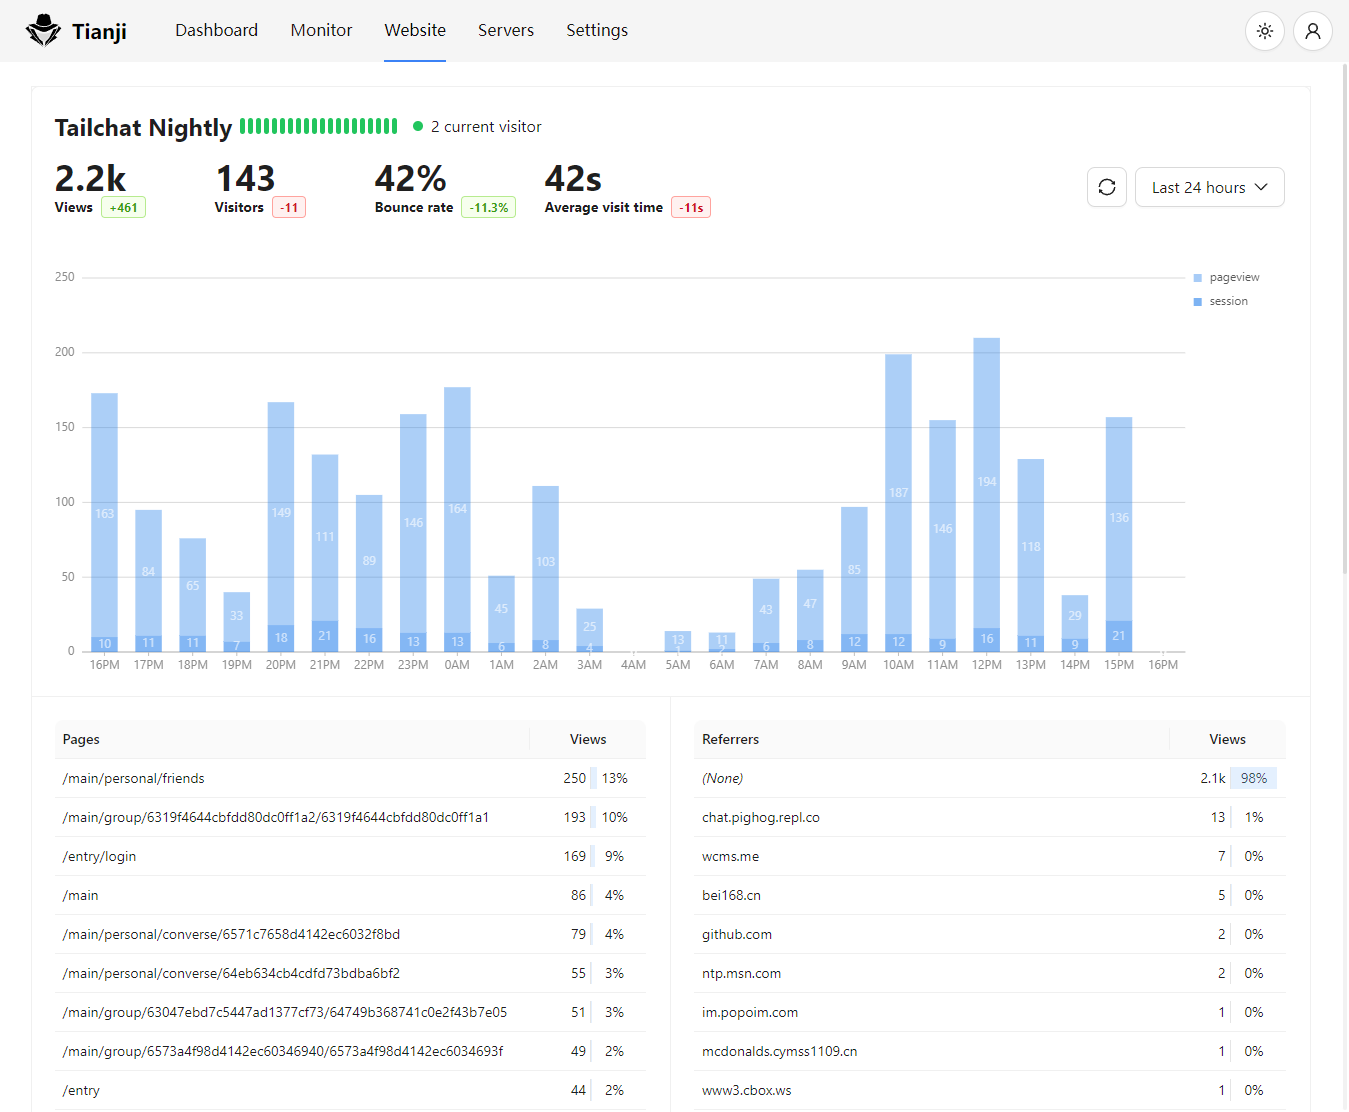
Tianji is an open-source self-hosted lightweight application that combines website analytics, uptime monitoring, and server status reporting. While specialized tools are beneficial for experts, an all-in-one application would be more convenient and user-friendly for most users with lighter needs.
Features
- Responsive user-interface
- Real-time uptime monitoring
- Add unlimited websites, pages and servers
- Graphs and charts
- API monitoring
- Integrated application
- Lightweight software
- Website analytics
- Uptime monitoring
- Server status reporting
- Problem notification
- Telemetry
- OpenAPI
 msgbyte
Uptime Kuma
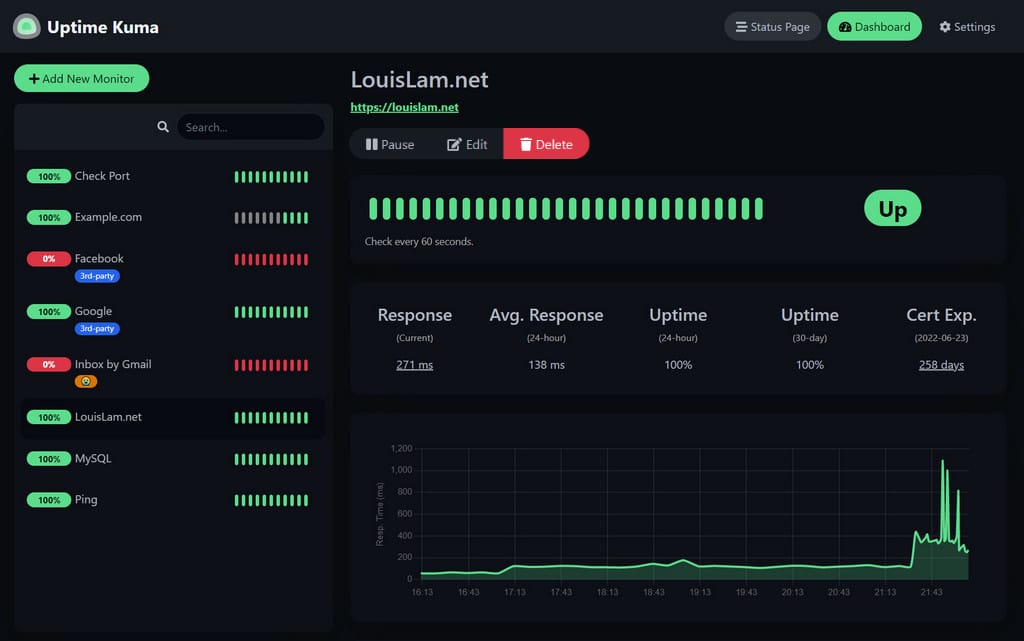
Uptime Kuma is an easy-to-use self-hosted website and server uptime monitoring tool.
Features
- Monitoring uptime for HTTP(s) / TCP / HTTP(s) Keyword / HTTP(s) Json Query / Ping / DNS Record / Push / Steam Game Server / Docker Containers
- Fancy, Reactive, Fast UI/UX
- Notifications via Telegram, Discord, Gotify, Slack, Pushover, Email (SMTP), and 90+ notification services.
- 20-second intervals
- Multi Languages
- Multiple status pages
- Map status pages to specific domains
- Ping chart
- Certificate info
- Proxy support
- 2FA support
- Easy to install using Docker
louislamUpptime
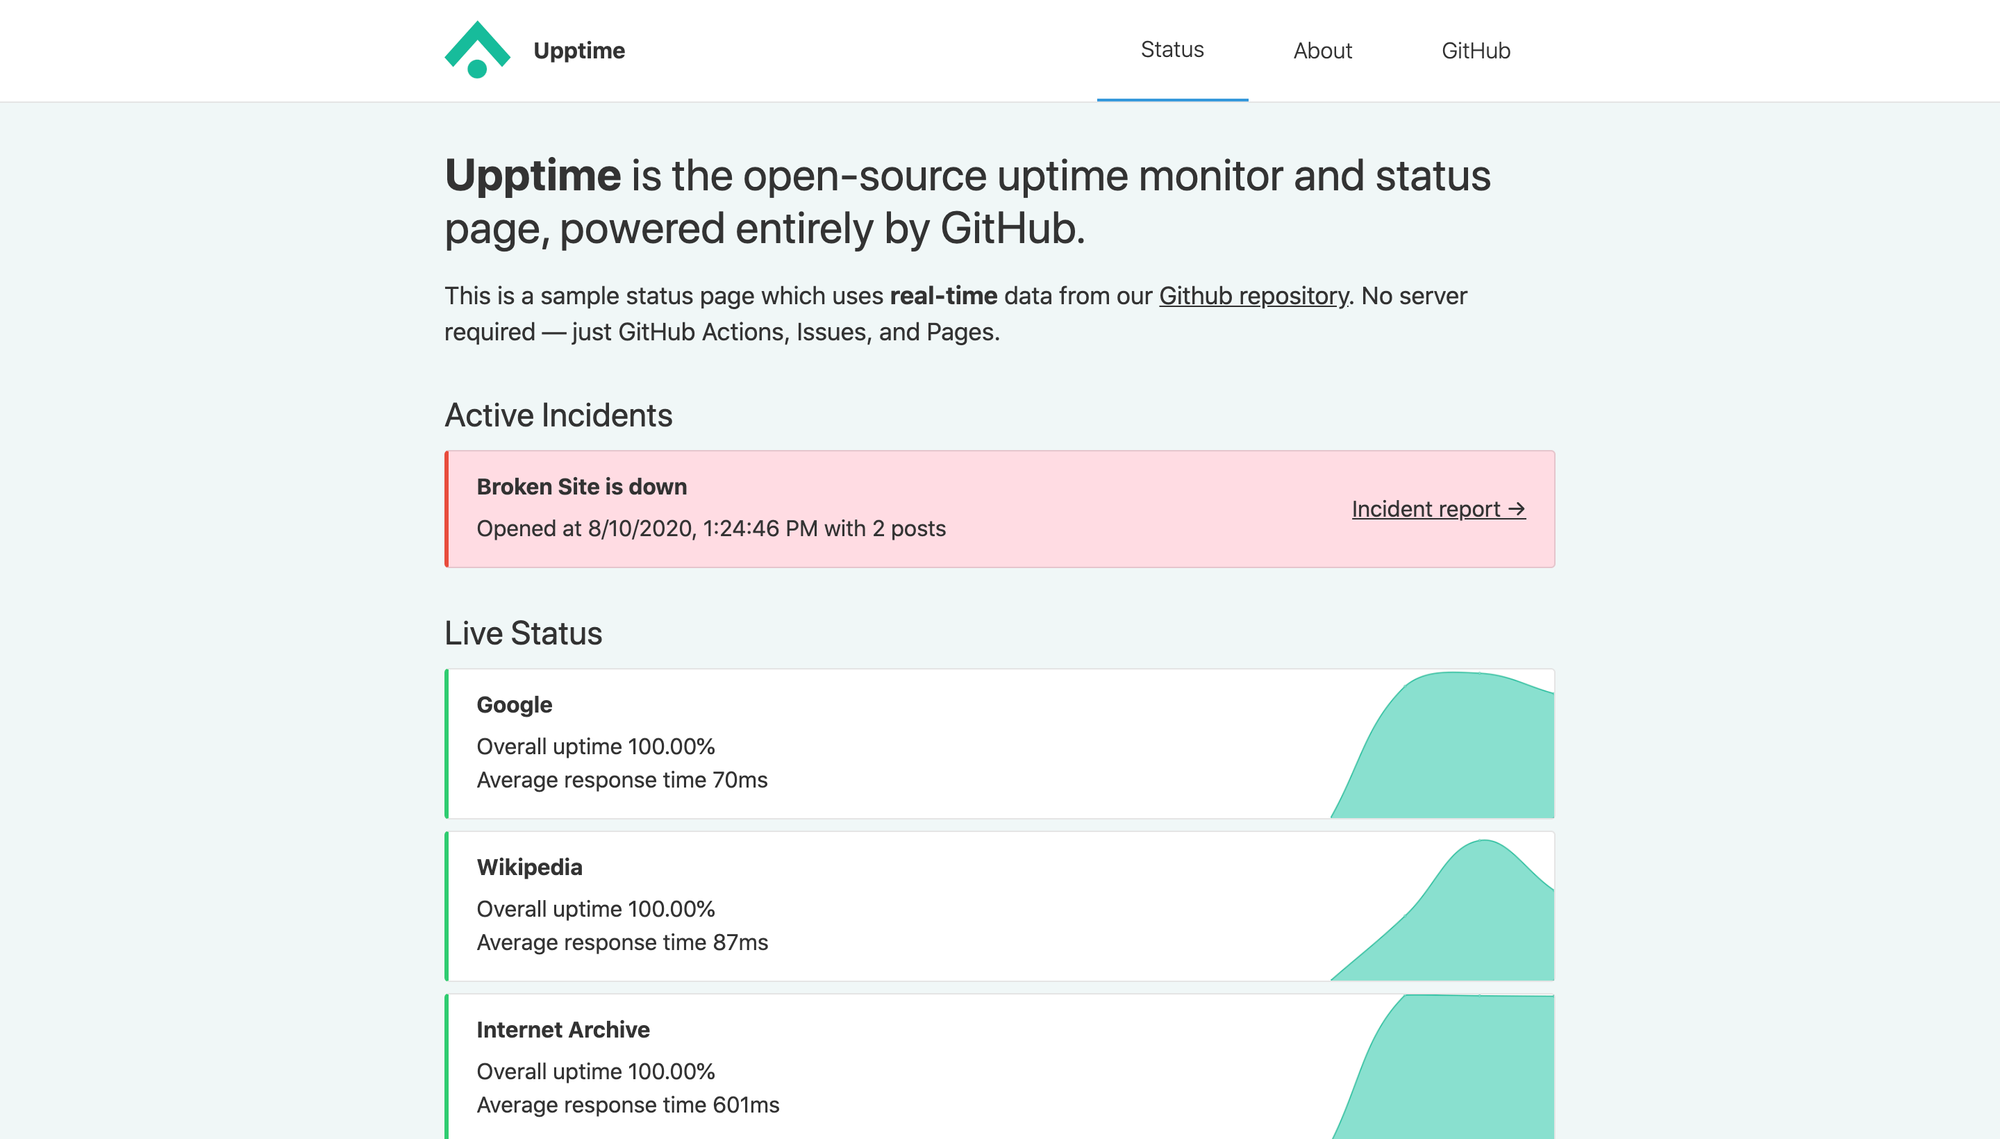
Upptime is an open-source uptime monitor and status page powered by GitHub Actions, Issues, and Pages. It operates by using GitHub Actions as an uptime monitor, checking websites every 5 minutes and recording response times every 6 hours. Graphs of response times are generated daily.
GitHub Issues are used for incident reports, with issues automatically opened if an endpoint is down and closed when the site is back up. The status website is a simple, accessible PWA built with Svelte and Sapper, fetching data from the repository using the GitHub API.
Features
- Open-source uptime monitor
- Powered by GitHub Actions, Issues, and Pages
- Checks websites every 5 minutes
- Records response times every 6 hours
- Generates graphs of response times daily
- Uses GitHub Issues for incident reports
- Status website built with Svelte and Sapper
- Fetches data from the repository using the GitHub API
- Monitors unlimited webpages
- Stores version-controlled response time stats
- Provides a modern status page website
- Offers outage history and long-term trend charts
- Built-in notification support for Slack, Telegram, custom webhooks, and more
upptimeUpstat
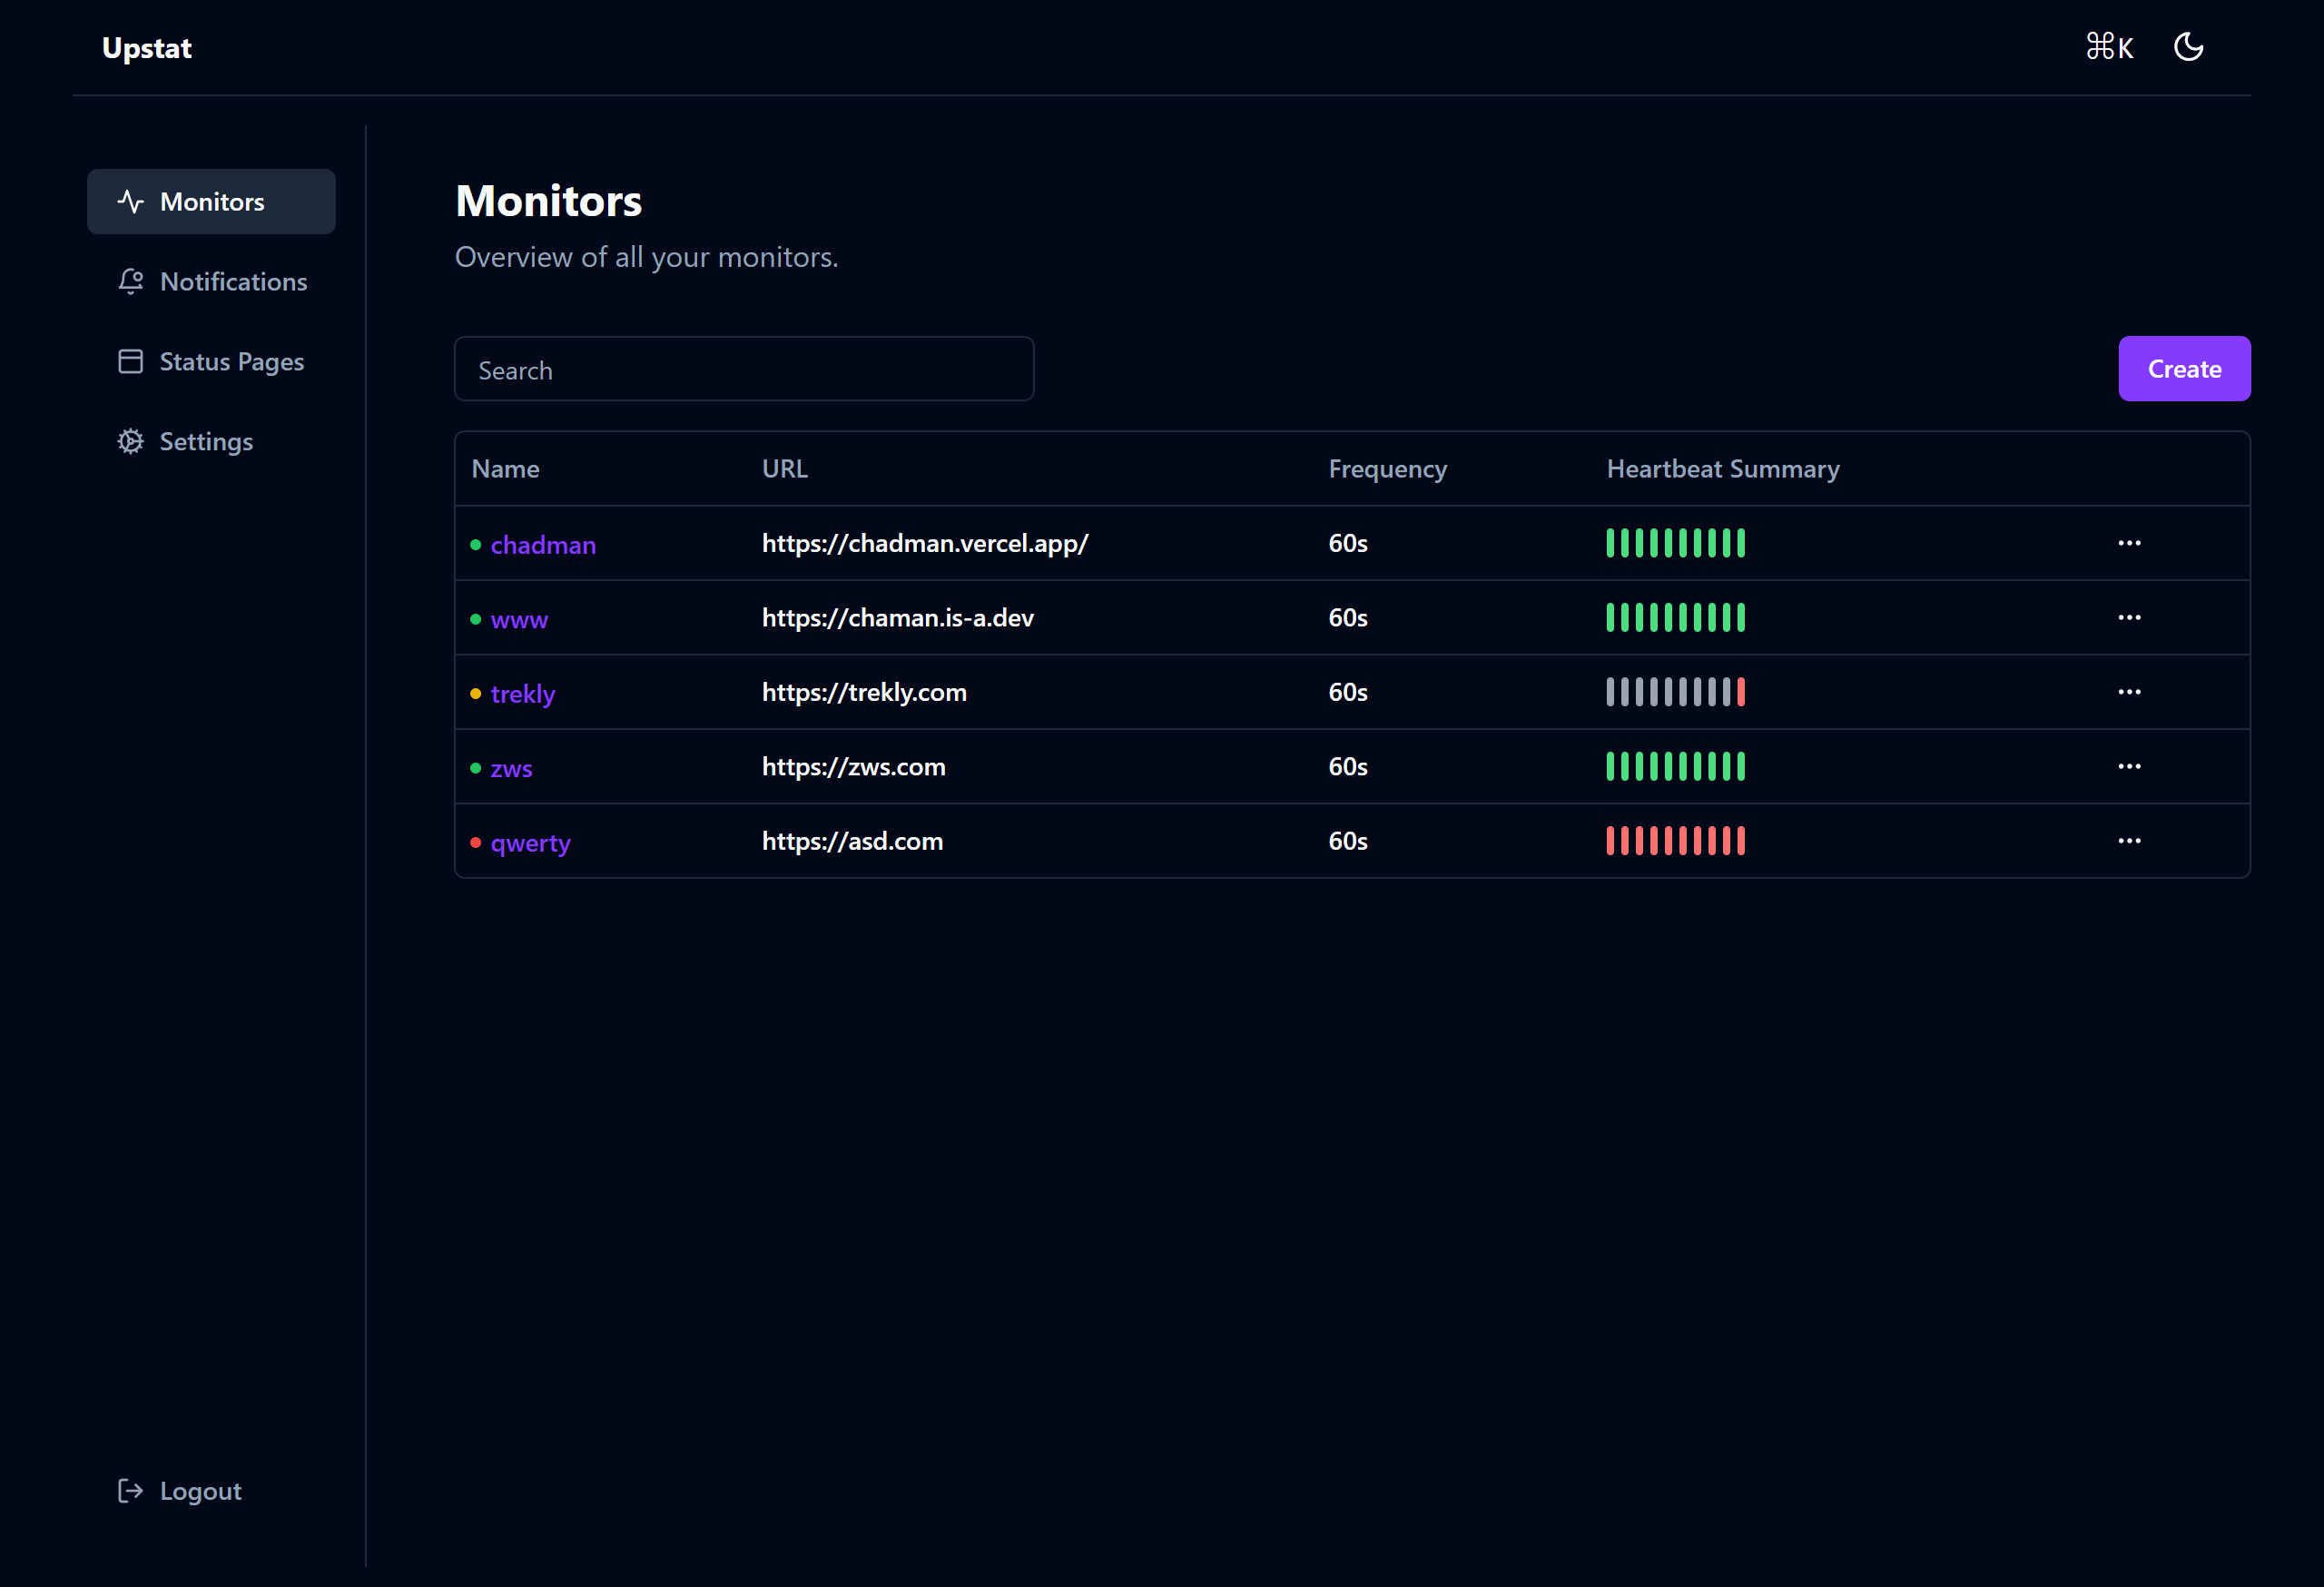
Upstat is a free and open-source simple and easy-to-use self-hosted status monitoring tool.
Features
- Monitoring uptime for HTTP(s)
- Status and Latency Chart
- Notifications via Discord
- 60-second intervals
- Fancy, Reactive, Fast UI/UX
- Multiple status pages
- Map status pages to specific domains
- Ping chart
- Certificate info
- Easy to install using Docker
chamanbravoHertzBeat
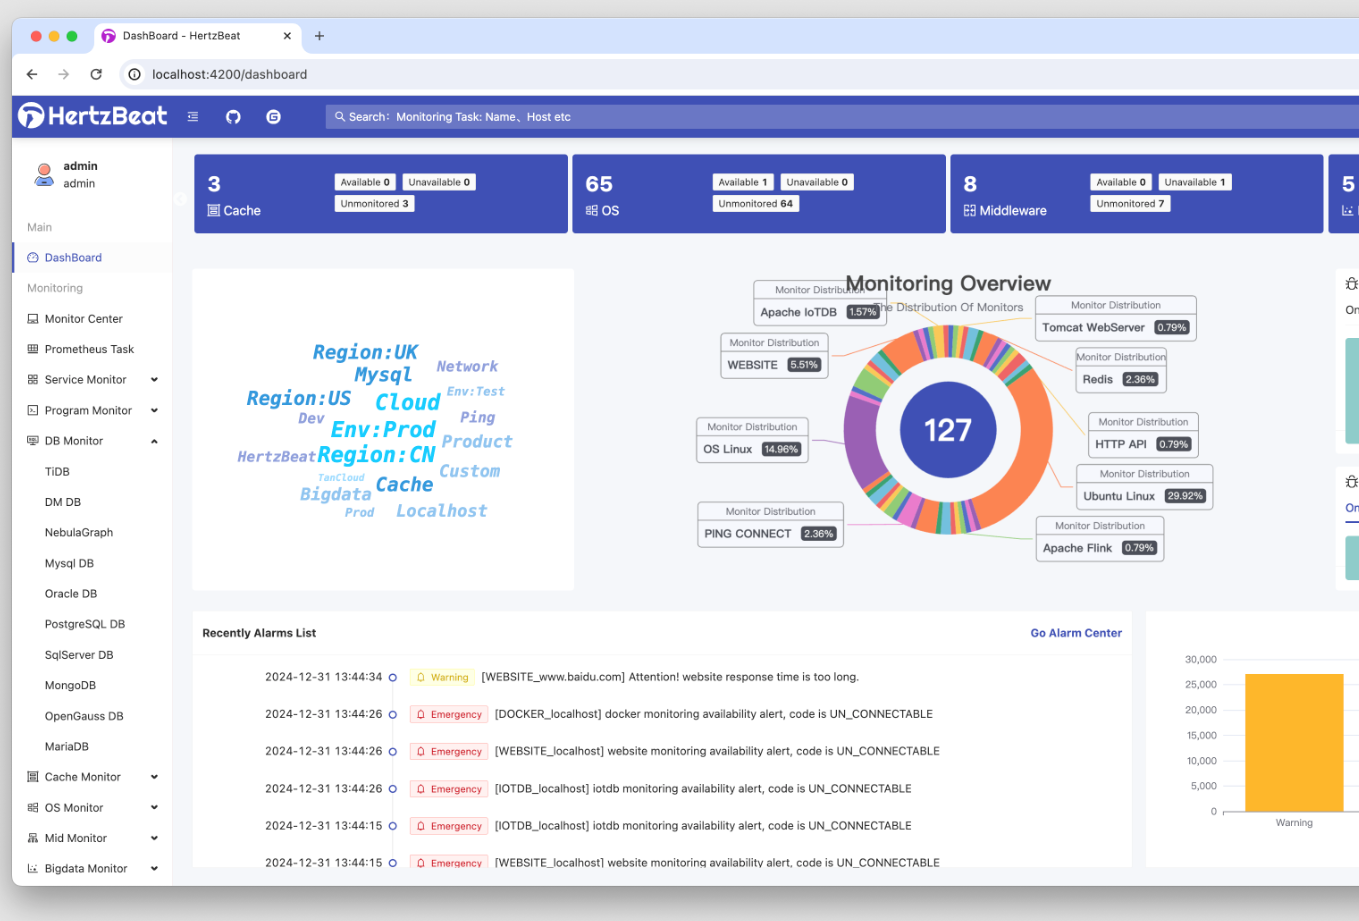
HertzBeat is an open-source, real-time monitoring system that combines monitoring, alarm, and notification features. It supports a wide range of applications, including web services, programs, databases, caches, operating systems, webservers, middleware, big data, cloud-native, network, and custom monitoring.
Features
- Combines monitoring, alarm, and notification features into one platform
- Supports a wide range of applications
- Agentless and easy to use
- Web-based with one-click monitoring and alerting
- Configurable protocols such as Http, Jmx, Ssh, Snmp, Jdbc, Prometheus
- Compatible with the Prometheus ecosystem
- High performance with support for horizontal expansion of multi-collector clusters
- Supports multi-isolated network monitoring and cloud-edge collaboration
- Provides flexible alarm threshold rules
- Timely notifications delivered via multiple platforms
- Powerful status page building capabilities
dromaraGatus
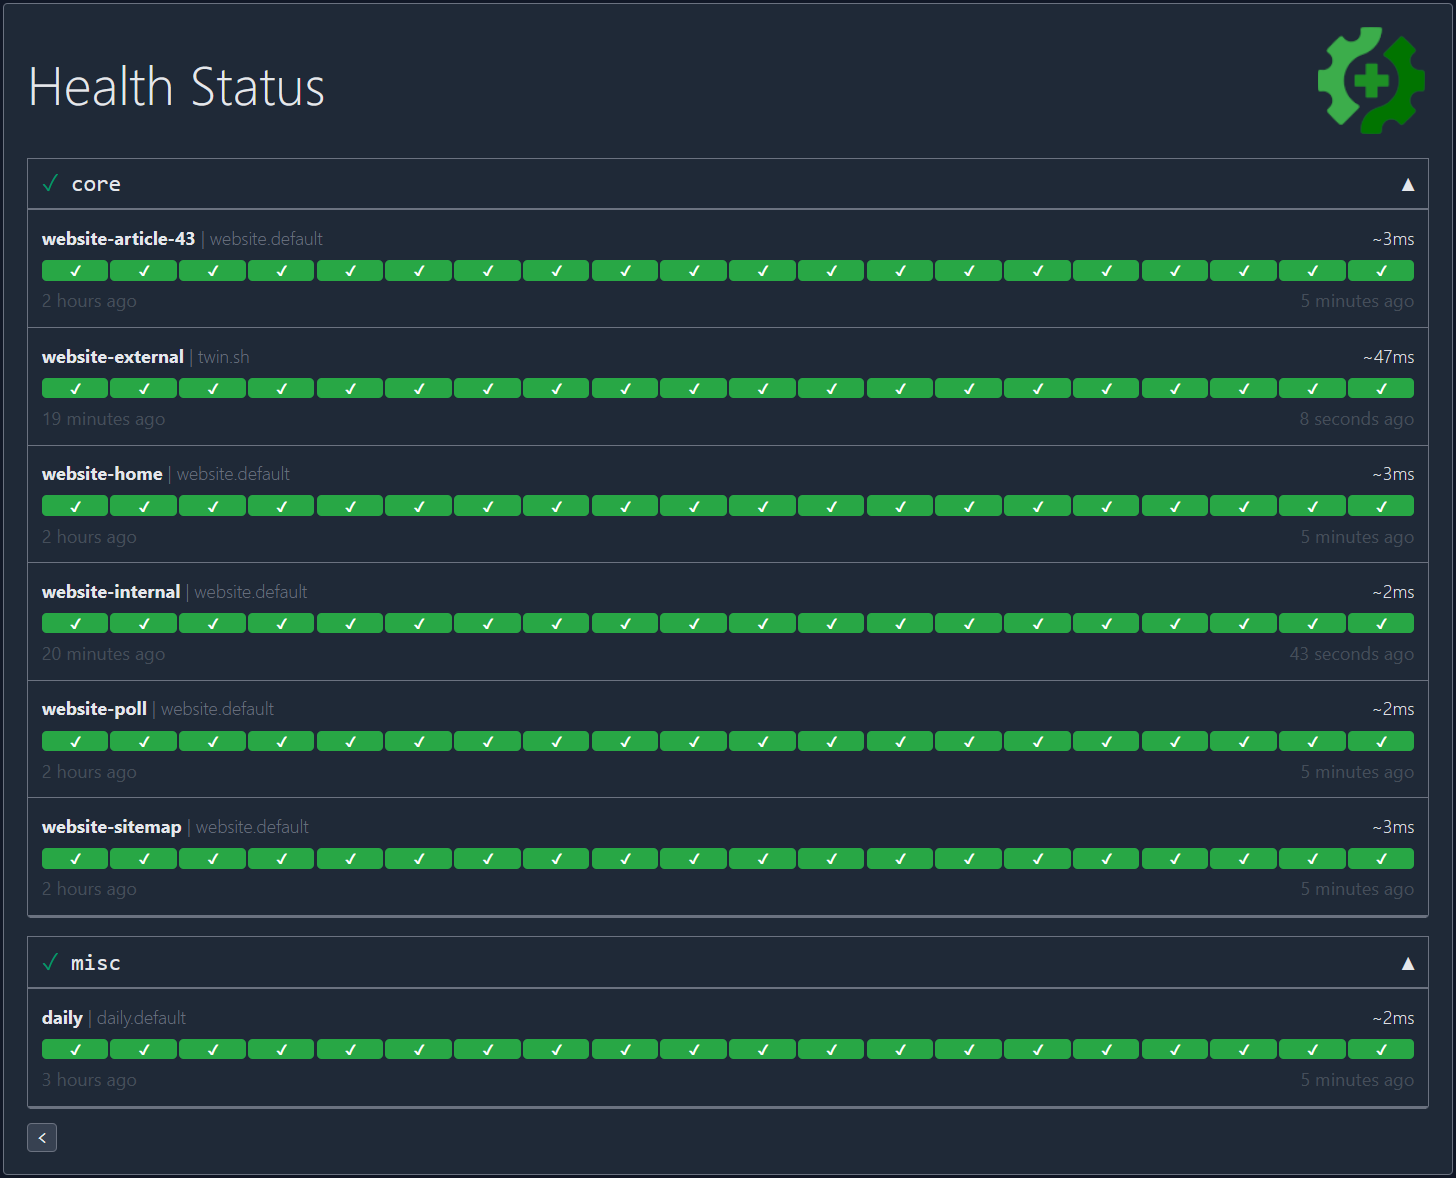
Gatus is a self-hosted web-based health dashboard for developers that allows monitoring of services using various queries and conditions. It can also pair health checks with alerts through various platforms such as Slack, Teams, PagerDuty, and Discord. The author uses it to monitor the status of their core applications in a Kubernetes cluster.
Features
- Highly flexible health check conditions
- Ability to use Gatus for user acceptance tests
- Email notification
- GitHub, GitLab, Google Chat, Matrix, Mattermost, Ntfy alerts
- Easy configuration
- Alerting support for various platforms
- Low resource consumption
- Badges for uptime and response time
- Dark mode support
- Easy to install using Docker
- Built-in Slack alert support
- Twillio Alerts
TwiNLaravel Uptime Monitor
Laravel-uptime-monitor is a powerful, easy-to-configure uptime monitor that notifies users when their site is down or when an SSL certificate is about to expire.
It leverages Laravel's native notifications for easy integration with various notification providers. Detailed documentation is available online, and a standalone version is also provided for those not familiar with Laravel.
spatieOdin
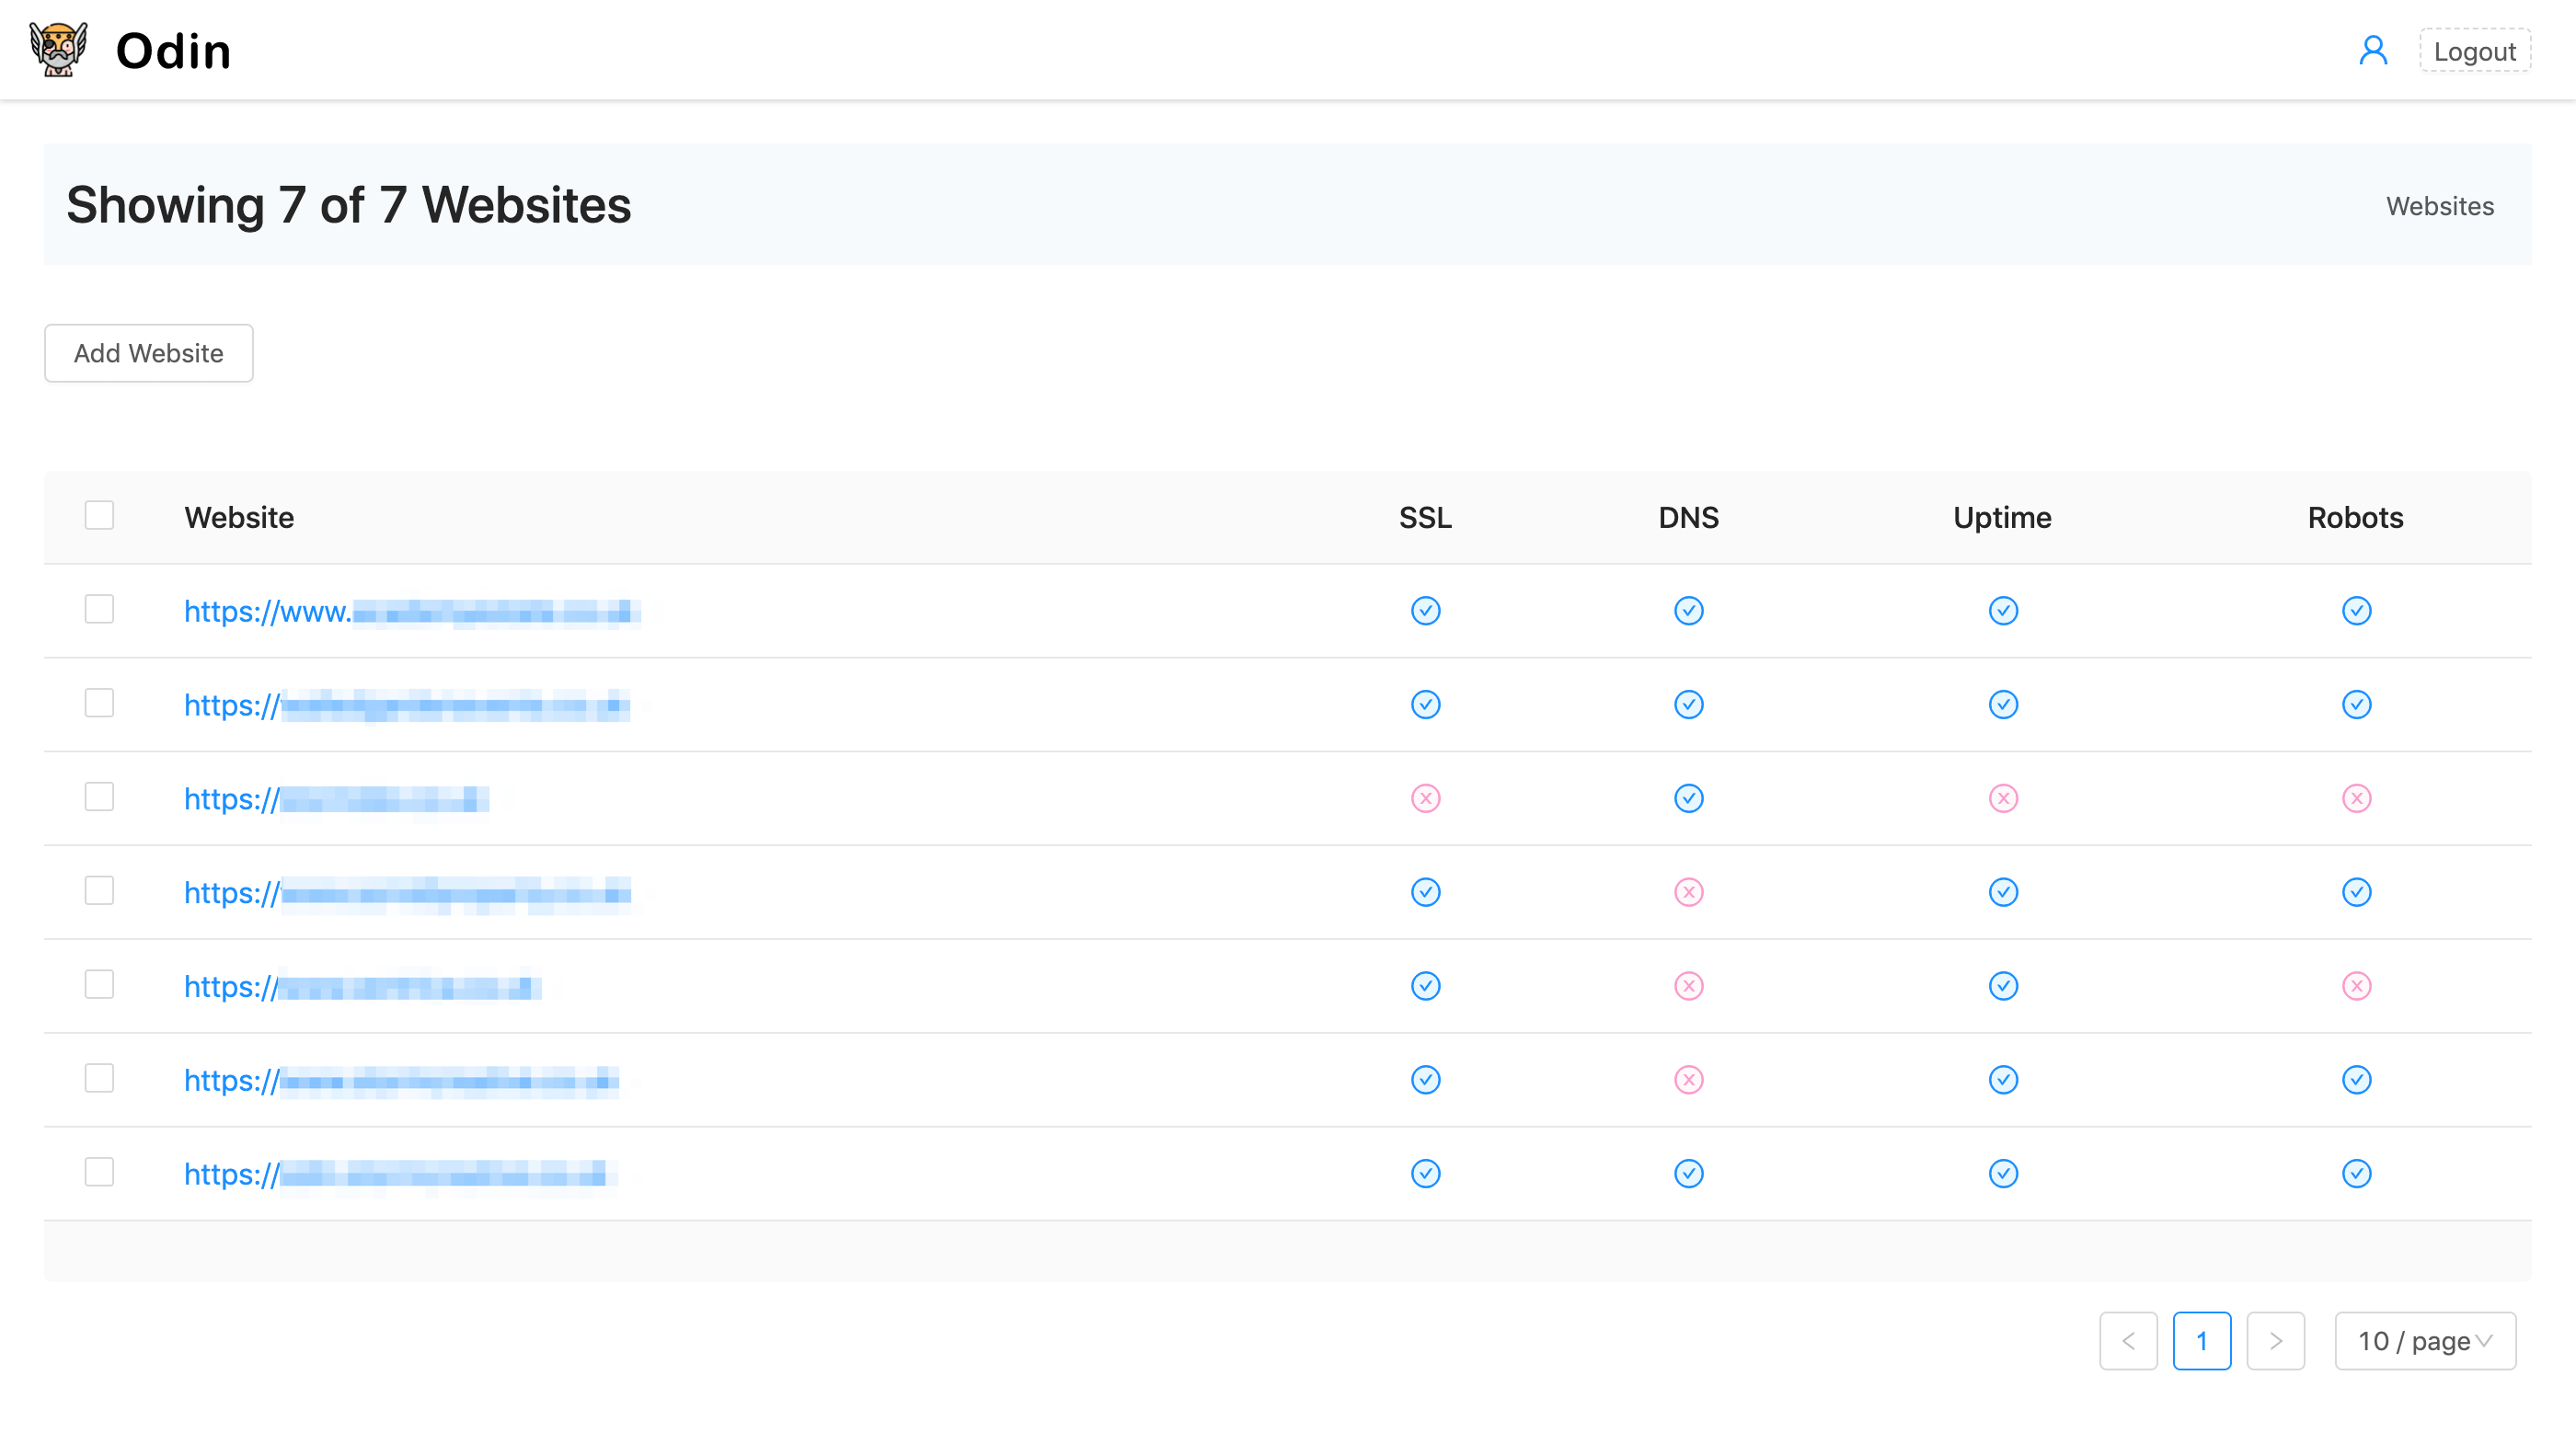
Odin is status page that is built using the Maelstrom CMS Toolkit. It's an in-house tool used for basic monitoring with email alerts, receiving regular bug fixes and new features as needed.
While it is not a final release and lacks automated testing, it's been open-sourced for others to use. Odin is a domain monitoring tool that provides OpenGraph extraction, uptime monitoring with response-time graphs and email notifications, downtime event tracking with duration, and SSL Certificate grading via SSL Labs.
maelstrom-cmsServer Status
The Server Status Project provides a simple server status page written in PHP, which can run on PHP 5.5+ and even on shared webhosting without shell access. Installation involves placing the files on your server and accessing it from your browser, or manually filling in the info in config.php.template and renaming it to config.php.
server-status-projectMiniboard
Miniboard is a free, open-source, web-based lightweight dashboard offering features such as tabs, uptime monitoring, and notifications. It can be configured through a GUI or a yaml file.
acebergPong
Pong is a minimal availability monitoring system offering email alerts and push notifications. It is a dockerized Rails application run via docker-compose, requiring both a host running docker and a client with compose.
By default, Pong uses mailgun for ActionMailer delivery due to its easy integration and sufficient free monthly sends for occasional email alerts.
rhardihHothost
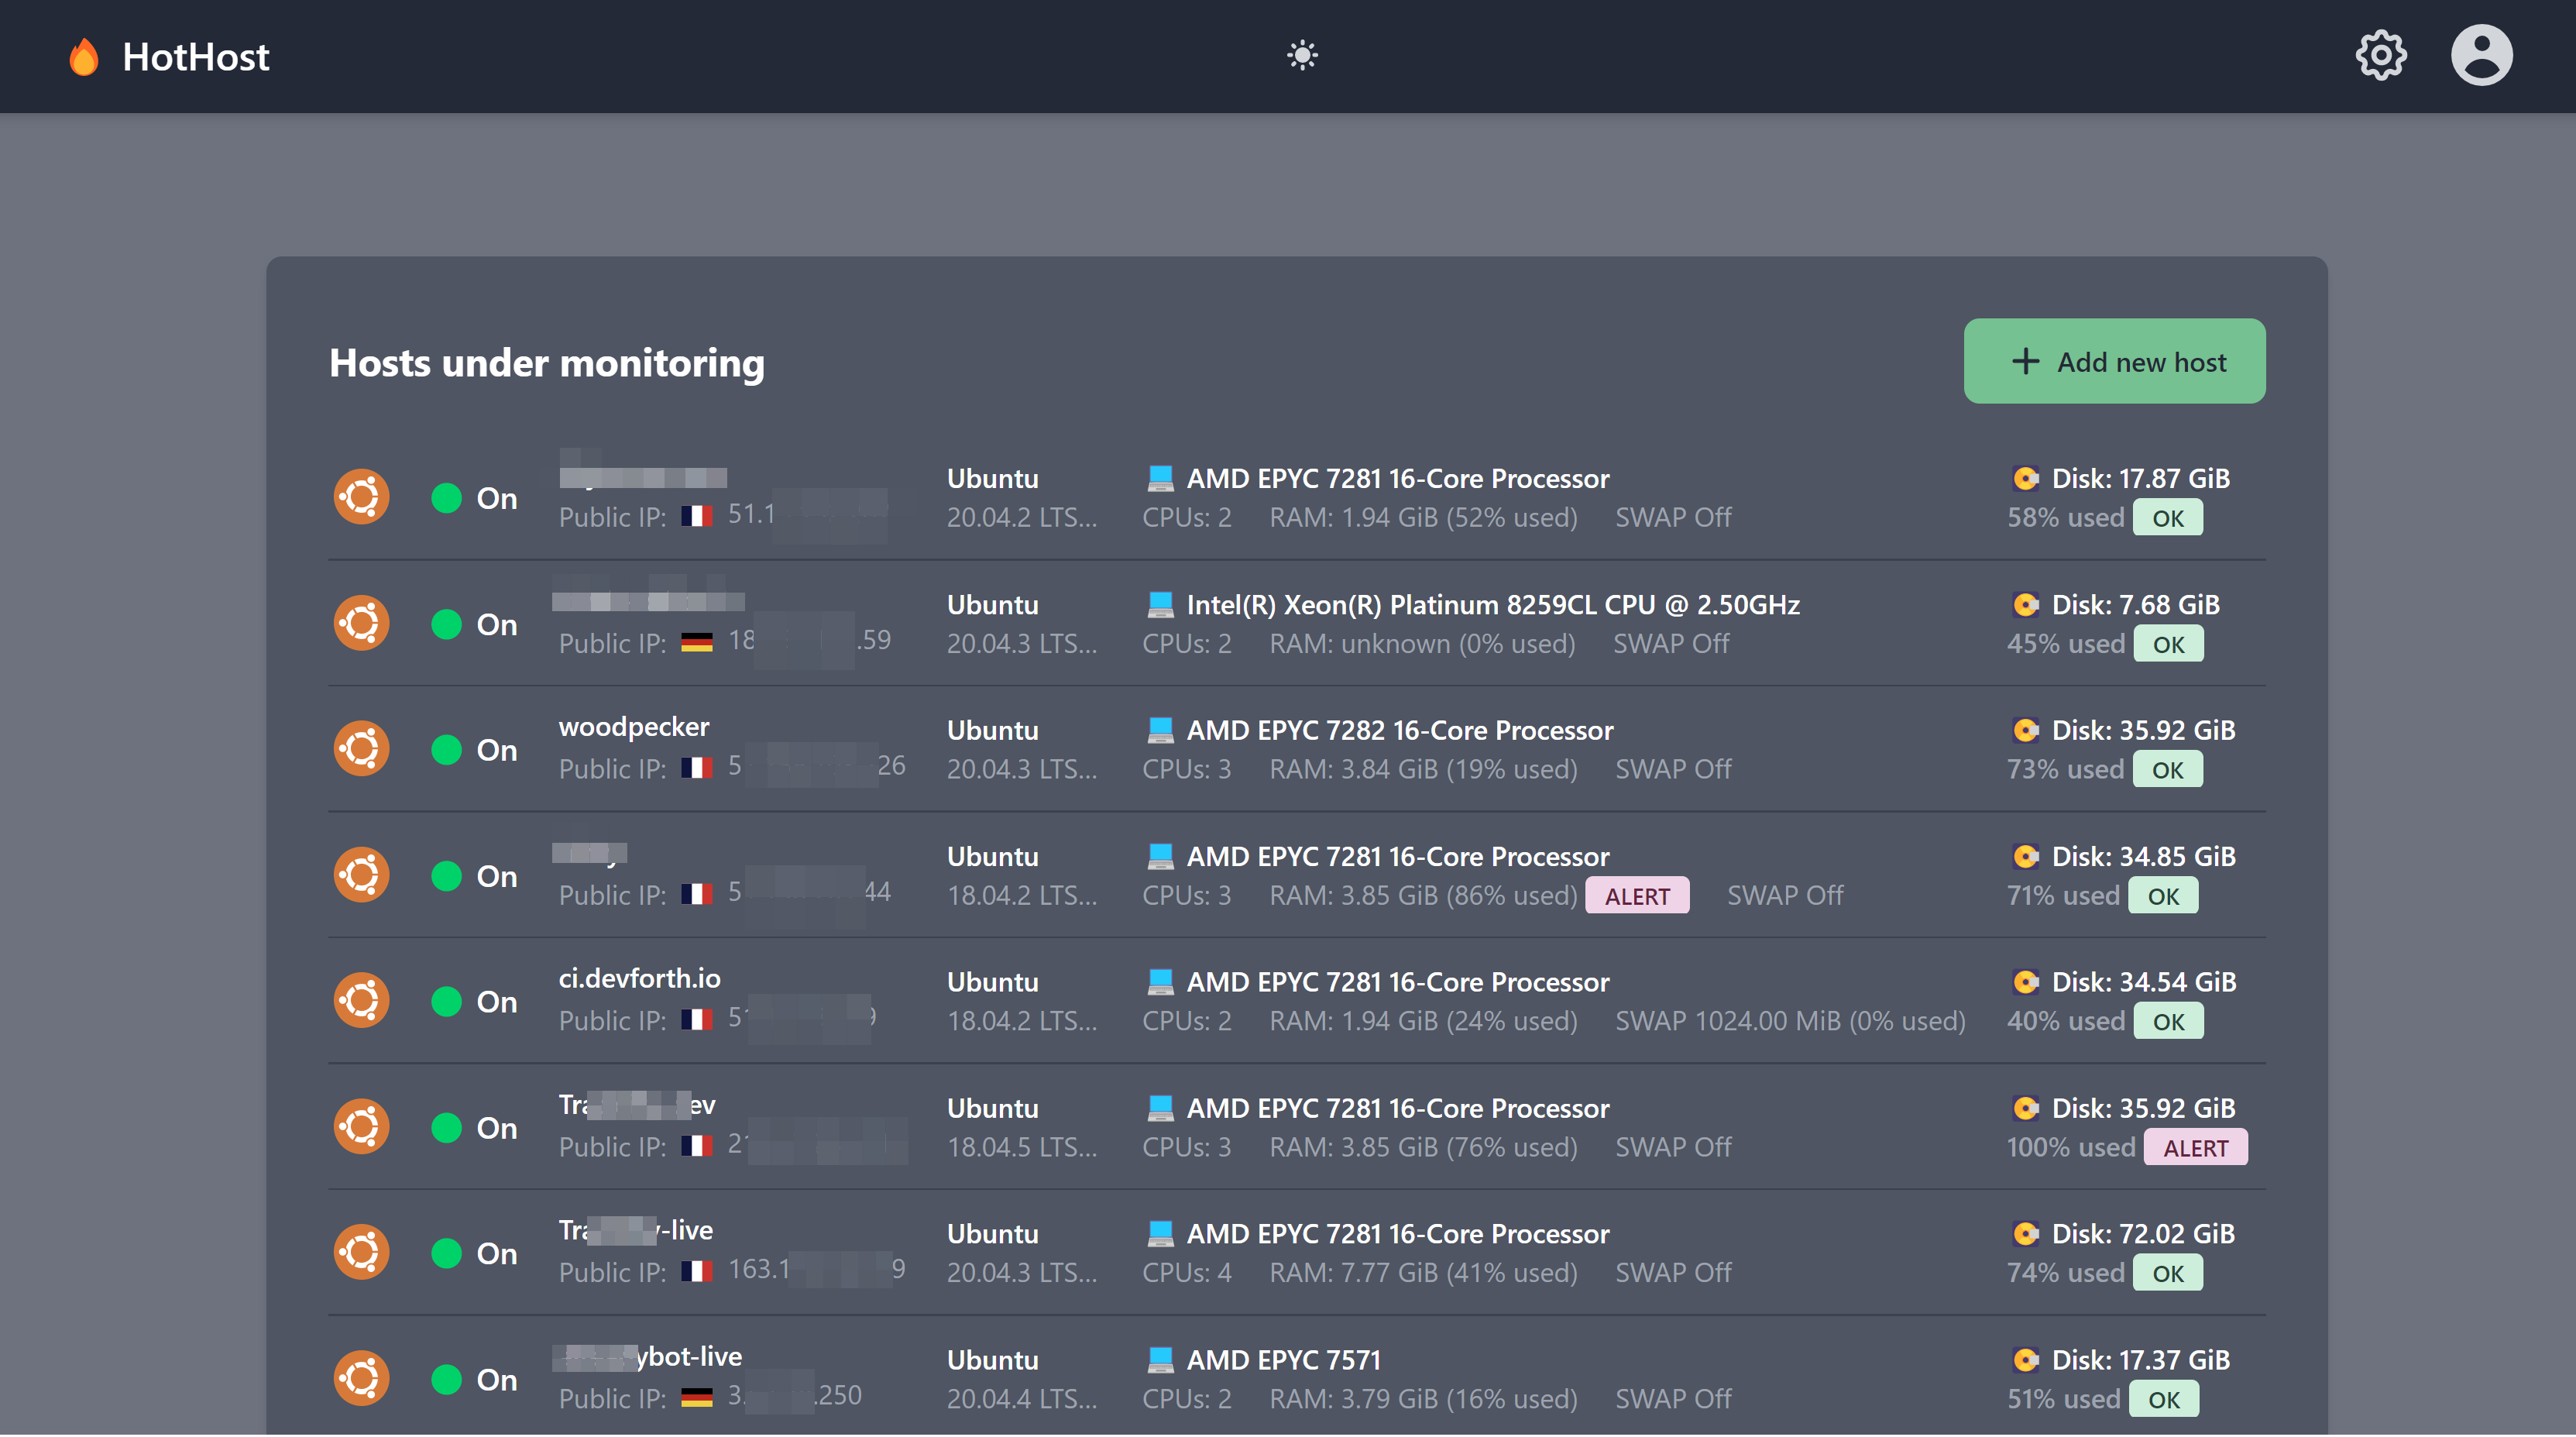
HotHost is a free and open-source self-hosted Lightweight and minimalistic free and open source Servers and HTTP monitor.
Features
- 💾 Shows used disk space percentage and ALERT badge if it exceeds configurable threshold (90% by default)
- 🧠 Shows used RAM percentage and ALERT badge if it exceeds configurable threshold (90% by default)
- ☎️ Built-in plugins to setup free Email/Slack/Telegram notifications
- 🪧 Agents installed using simple code snippets. Options: Docker/Compose/Bash+curl+crontab.
- 🏙 Allows to monitor as many hosts as needed
- ⏰️ Configurable monitoring interval
- 📈 View top 10 processes consuming RAM, historically over last 2 days.
- 🌐 HTTP / HTTPS Monitor, status code check, webpage keywords existence, basic auth, notifications
- 🔒 HTTPS SSL check with expiration reminder (default is 14 days prior to expire, configurable)
- Easy to install using Docker and Docker Compose
devforthAutoKuma
AutoKuma automates the creation of Uptime Kuma monitors based on Docker container labels, eliminating the need for manual monitor creation.
Kuma CLI is a tool for managing and interacting with Uptime Kuma, allowing for easy configuration, monitoring, and management of applications from the command line.
BigBootMonitstatus
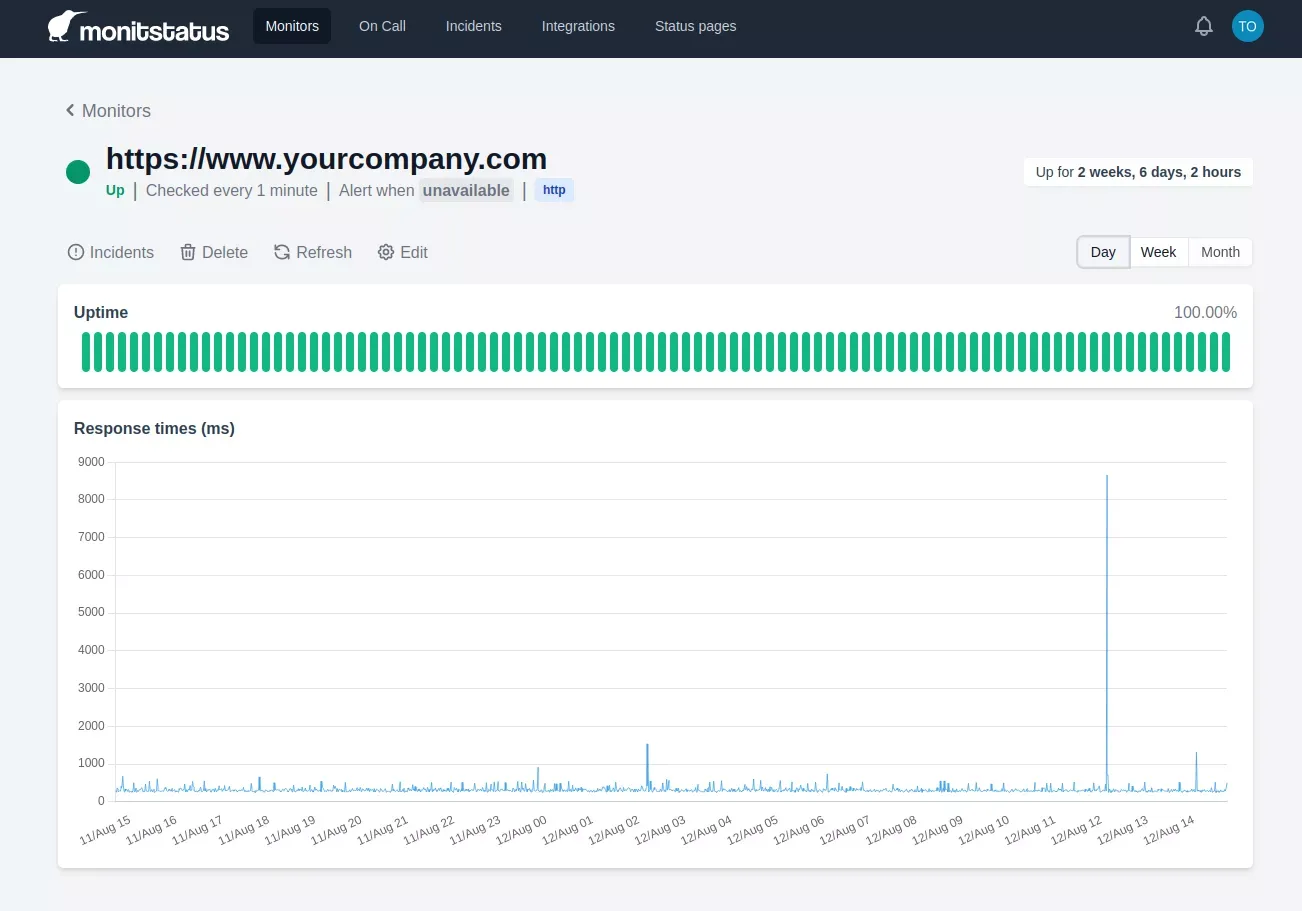
Monitstatus is an SRE observability and incident management suite offering uptime monitoring, incident alerts, and customized status pages. It allows for monitoring of various services with periodic checks and notifies users when an incident occurs.
Users can receive outage notifications through multiple integrations and manage incidents effectively. The suite also offers customized status pages for communicating with users. The on-call schedules feature is still in progress.
Key Features
- Uptime Monitoring: Monitor services such as webpages, APIs, servers or network services with periodic checks.
- Incident Alerts: Receive notifications of outages via multiple integrations and manage the incident causes.
- Customized Status Pages: Create beautifully crafted status pages to communicate status and incident management with users.
- On-call Schedules: Feature still in progress.
monitstatusMonico
Monico is a simple command-line utility for efficiently monitoring and analyzing the availability of websites.
Monico CLI is built with a focus on ease of use, flexibility, and reliability. It allows configuring website monitoring to collect essential data such as response times, status codes, and content checks, storing all information in a structured format for easy retrieval and analysis.
Features
- Easy Configuration: Set up monitors for websites with a simple CLI.
- Flexible Monitoring: Define custom intervals and content checks for each monitor.
- Data Insights: Review monitoring data directly from CLI.
- Secure and Reliable: Built with security and reliability in mind, ensuring your monitoring is always up and running.
ScorpilUptime Monitor
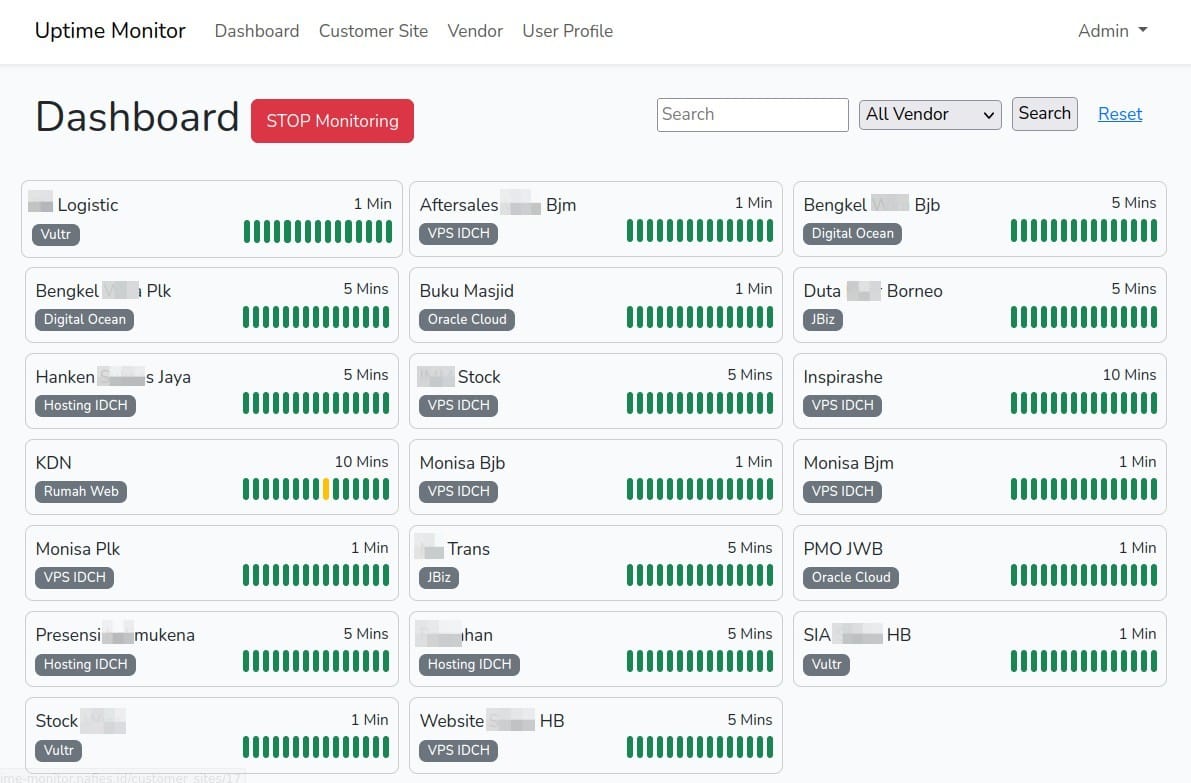
Uptime Monitor is a self-hosted web monitoring tool, built with laravel.
Features
- Monitor your web uptime per minutes (or any time interval)
- Record response time on each web
- Show uptime badges in 3 colors: green for up, yellow for warning, red for down, based on response time
- Send telegram notification when you site down for 5 minutes (based on check periode)
nafieslOneUptime
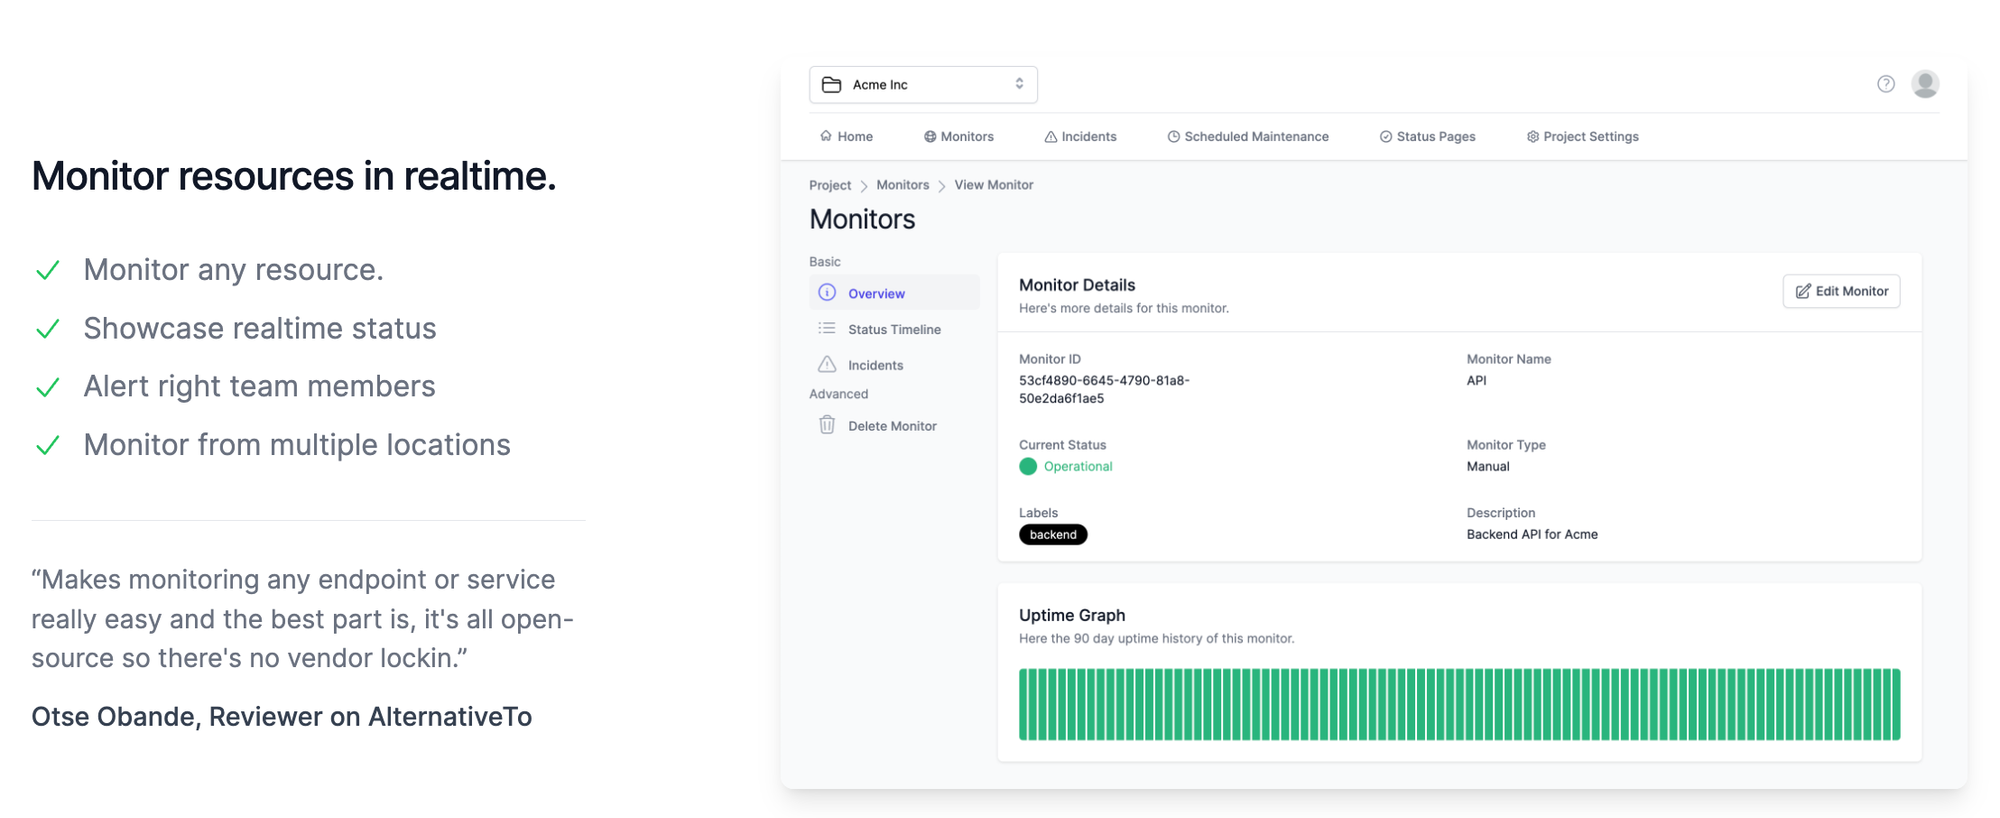
OneUptime is an open-source observability platform that monitors and manages online services. It alerts teams during downtime, provides a status page for customers, and assists in incident handling, on-call rotations, testing, service security, log analysis, performance tracking, and error debugging.
Current Features
- Uptime Monitoring: Monitors the availability and response time of online services from multiple locations globally.
- Notifications: Notifies teams via email, SMS, Slack, or other channels during downtime.
- Status Pages: Provides custom-branded status pages to communicate with customers and stakeholders during downtime or maintenance.
- Incident Management: Manages incidents from start to finish with a collaborative workflow.
- On Call and Alerts: Schedules on-call shifts for teams and defines escalation policies.
- Logs Management: Collects, stores, and analyzes logs from online services.
- Workflows: Integrates with existing tools and automates workflows.
- Application Performance Monitoring: Measures and optimizes the performance of online apps and services, tracking key metrics.
Coming Soon
- Error Tracking: Detect and diagnose errors in your online services. Get detailed error reports with stack traces, context, and user feedback. Replace tools like Sentry.
- Reliability Autopilot: Scan your code and fix performance issues and errors automatically. Get recommendations for improving the reliability of your online services.
OneUptimeUpBeat
UpBeat is a free and open-source self hosted server health monitor.
soorajshankarPulsy
Pulsy is an open-source monitoring tool that keeps an eye on your critical systems so you don't have to. With Pulsy, you can easily configure custom monitors for your applications and servers, set up notification channels for alerts, and view historical data on uptime and performance metrics.
Features
- Monitors multiple URLs simultaneously
- Configurable interval between requests
- Retry mechanism to handle temporary failures
- Logs HTTP response codes and response times to stdout/stderr (for now)
- Sends notifications to Telegram and Discord when the website is down
- Supports YAML configuration file for easy setup
11meLunalytics
Lunalytics is a free and Open source monitoring tool built with Node.js & React.
Features
- Easy to self-host
- Monitor uptime for HTTP(s)
- Support for multiple users
- Role based access control
- Clean and easy to use UX/UI
- Customizable themes/colors
- Customizable user profiles
KSJaayPing Bot
Ping Bot is a web application designed for network and server monitoring. It sends regular "ping" requests to various servers or devices to check their availability and response times, helping users monitor the uptime and performance of their online services.
Features
- Ping Monitoring: Ping Bot sends regular ping requests to specified servers or devices to check their availability.
- Response Time Tracking: It measures the response time of the ping requests to assess the performance of the monitored resources.
- Alerting: Ping Bot provides alert notifications via email or other channels if any monitored resources become unavailable or experience performance issues.
- Customization: Users can customize monitoring settings, including ping frequency, target servers/devices, and alert thresholds.
abhishekjnvkGoMon
GoMon is a self-hosted uptime monitoring service written in Go. It allows users to register URLs with a desired threshold, and it will make GET requests at a predetermined period.
If 5xx responses exceed the threshold within 5 minutes, an alert is triggered. The service also provides data on successful and failed calls in the past 24 hours.
gomonitoringUptimeFlare
UptimeFlare is a free PHP script web hook that manages down notifications from UptimeRobot. When a DOWN notification is received, it alters the A record of a domain on Cloudflare to a backup IP set by the user.
blackdotshAre We Down?
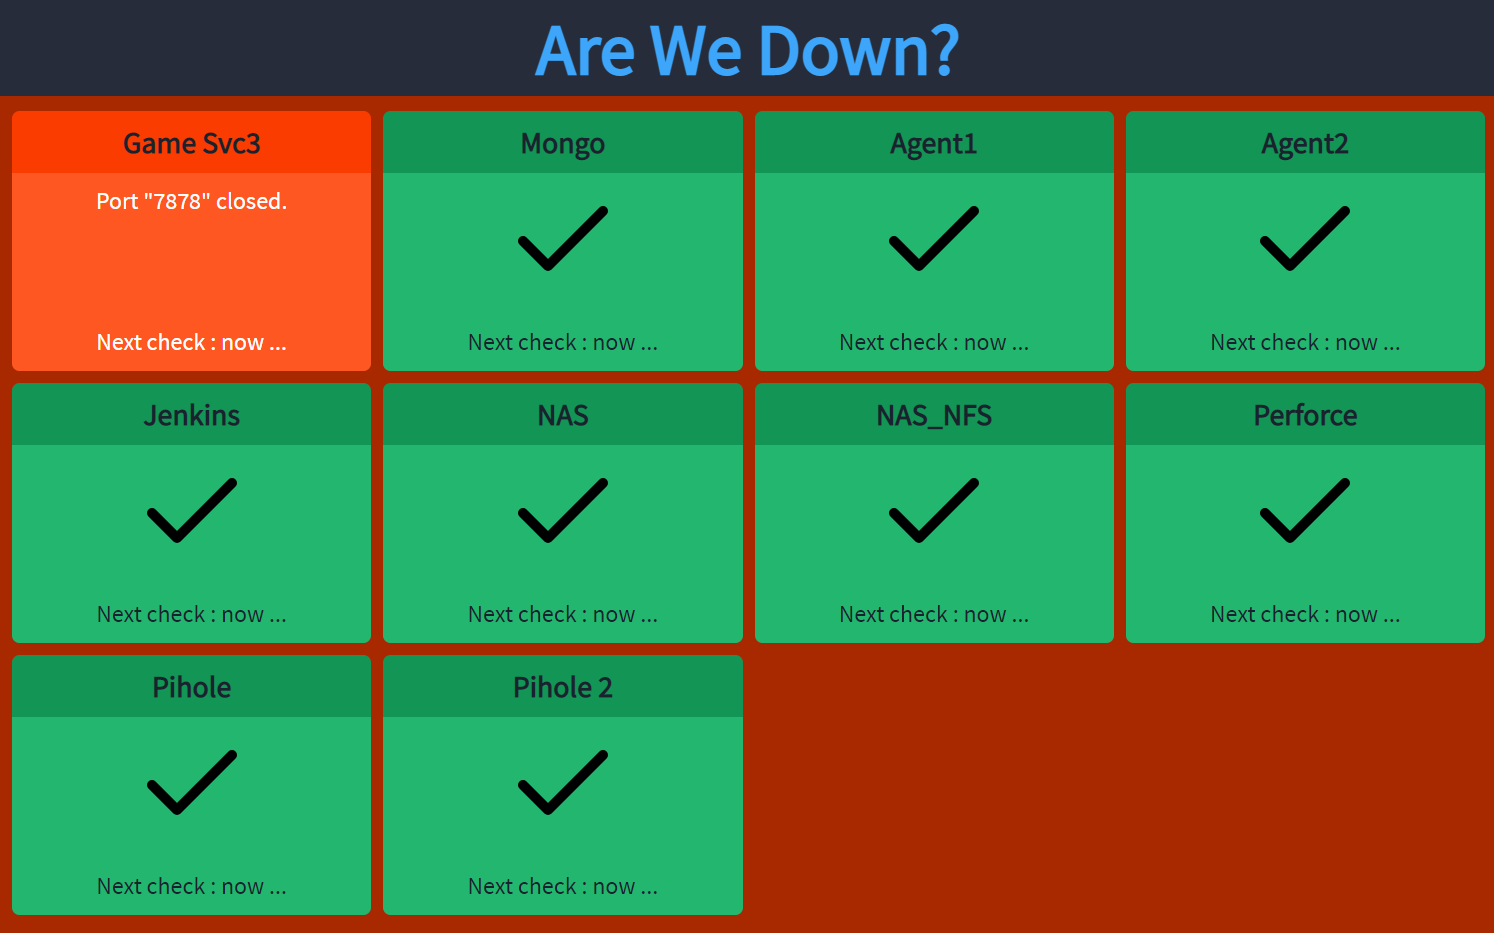
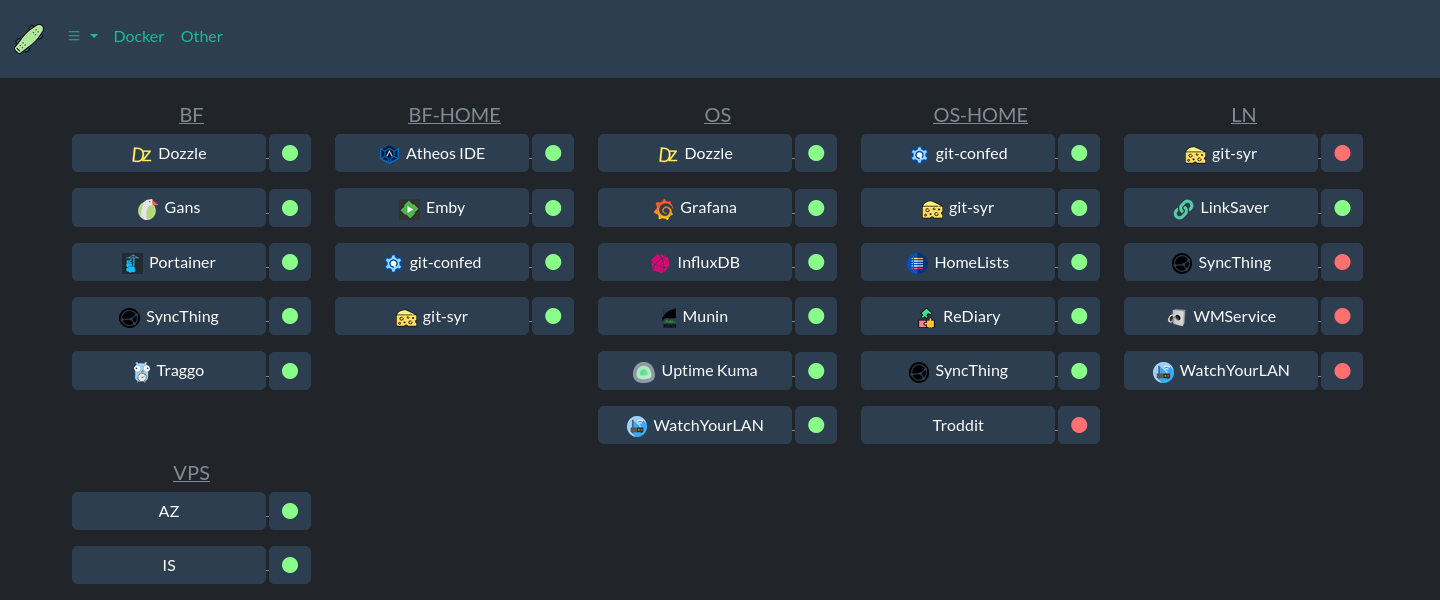
"Are We Down?" is a simple uptime monitoring system and dashboard ideal for home/self-hosting users. It allows for status monitoring of multiple services/networked devices on a private LAN, turning any HTTP endpoint into a status indicator and consolidating tests into single or multiple dashboards.
Features
- Simple to configure with just a few lines of text in a single YML file.
- No databases or dependencies on other services.
- Does HTTP status checks, ssh, ping, Docker container status and more.
- Sends alerts via email (SMTP) and Slack.
- Can be extended with your own test scripts using shell scripts, Javascript (NodeJS) or Python3 scripts.
- Runs on x86 and ARM (Docker images available for the Raspberry Pi 3 or better).
- Built-in dashboard will run on almost any browser, ideal for a Raspberry Pi in kiosk mode.
- API monitoring
shukriadamsUptimeMonitorWeb
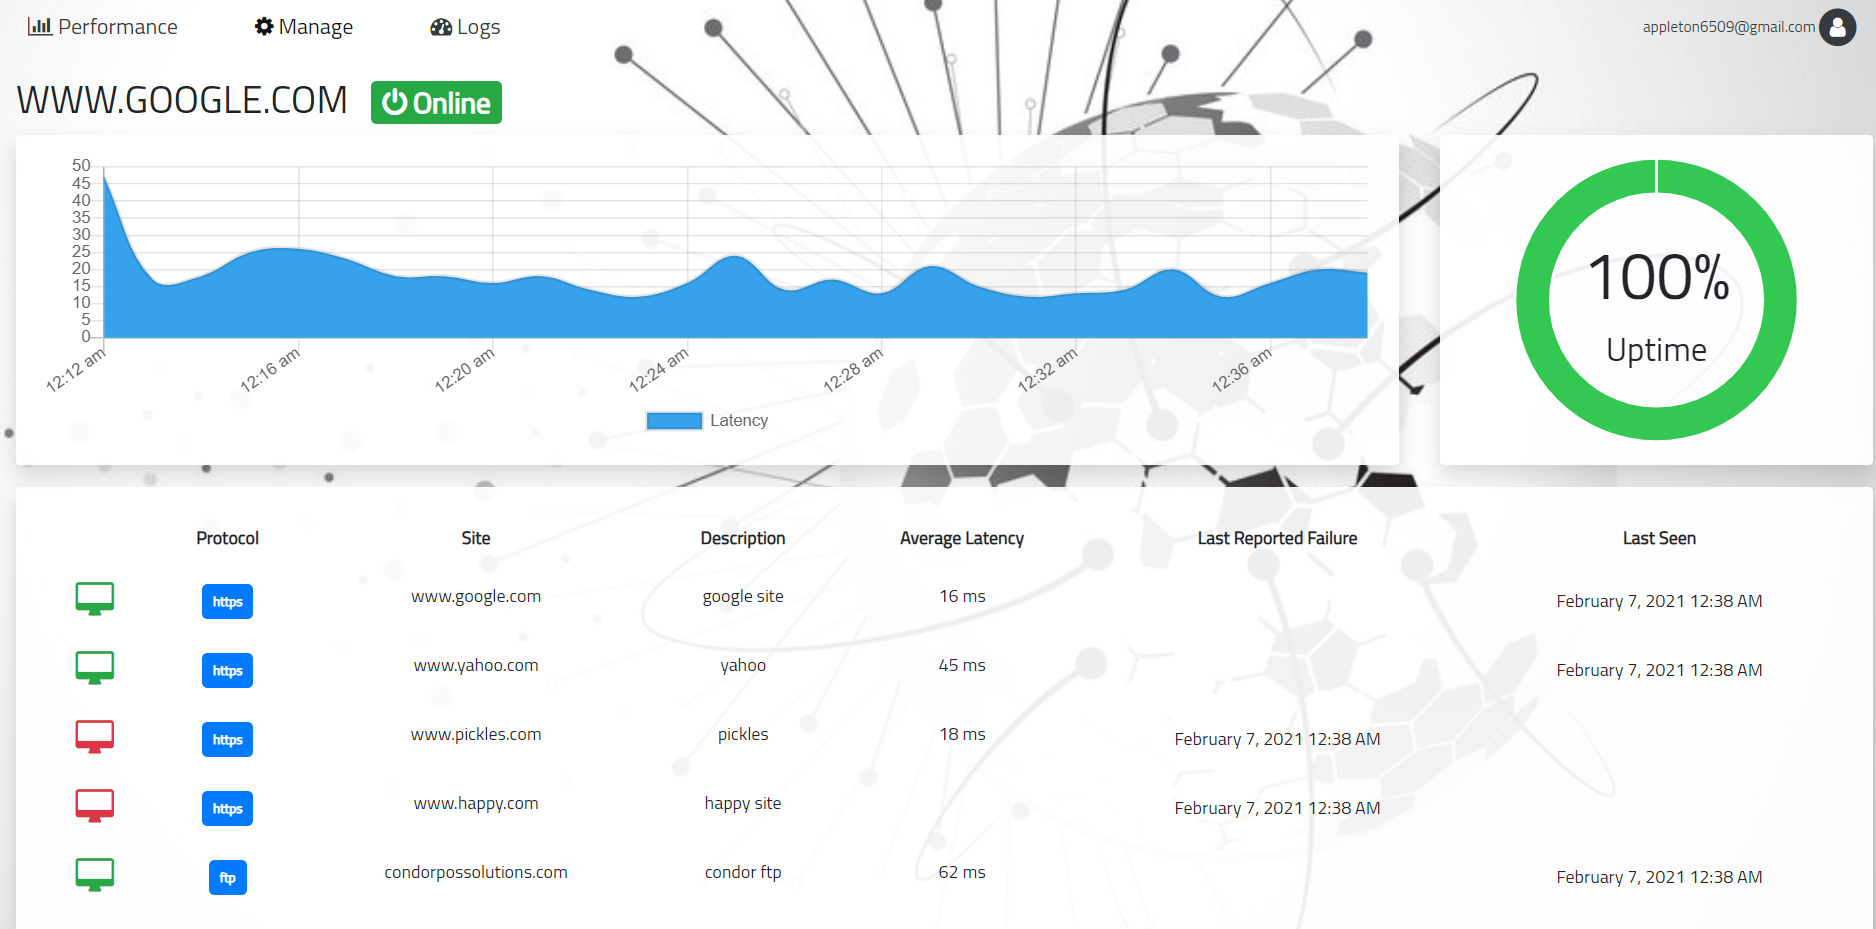
UptimeMonitorWeb is a self-hosted portal for monitoring the uptime of web-based endpoints, including websites and servers. It provides features such as chart reporting, logs, and email notifications. The project includes a web portal, and the source for the API, database, and background worker can be found elsewhere.
Features
- Uptime monitoring for websites, FTP's, servers and more
- Web portal
- Chart reporting
- Logs
- Email notifications
- Supports multiple protocols including: Https, FTP, SSH and more
appleton6509Cabot
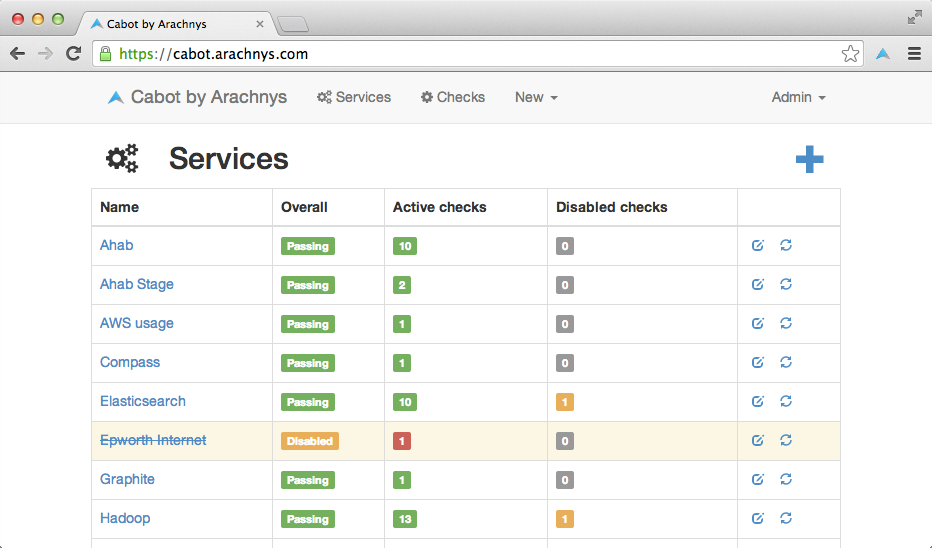
Cabot is a free, open-source, self-hosted infrastructure monitoring platform offering features similar to PagerDuty, Server Density, Pingdom, and Nagios without their cost and complexity.
It provides a web interface for monitoring services and sending alerts to your on-duty team if services start misbehaving or go down. It can use data already being pushed to Graphite/statsd to generate alerts.
arachnysUptimey
Uptimey is a simple server uptime monitor. It allows users to easily monitor their server's uptime and provides useful data that can be needed during server interaction. It is compatible with systems that run macOS, Linux, and Windows. Prerequisites for its use include having Git, Node.js (with NPM), and Bower properly installed on the user's computer.
stefanbcUPTIMESPY
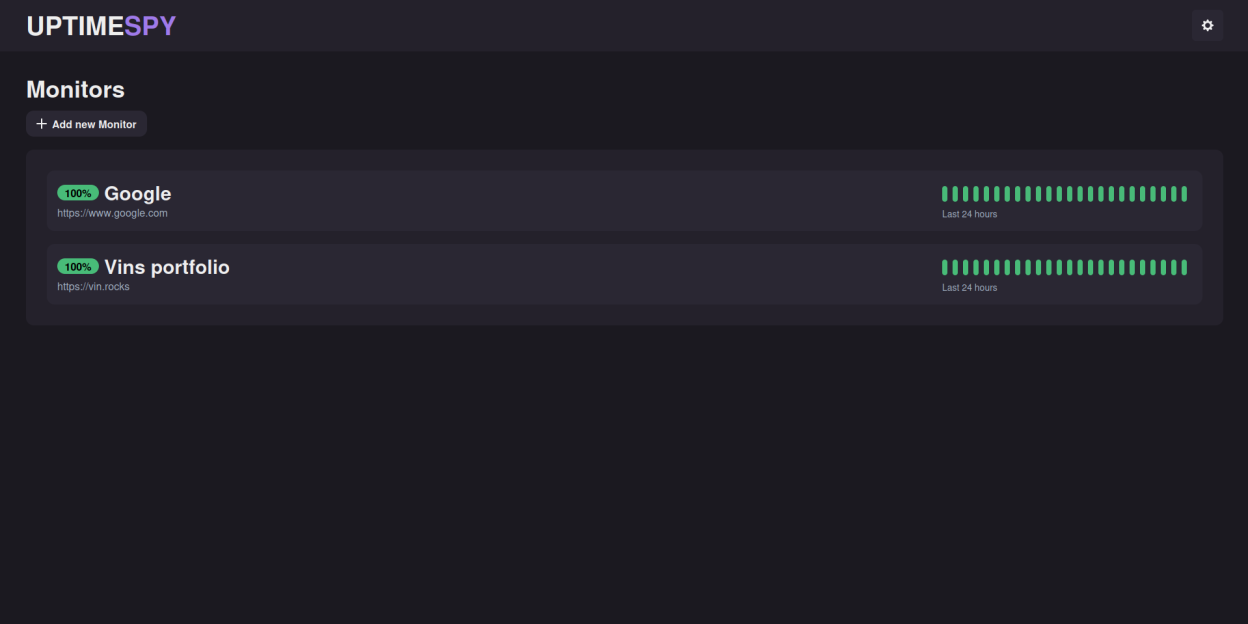
UPTIMESPY is a fast, lightweight, and user-friendly website monitoring tool developed by Vin H. It offers 24/7 monitoring, fast outage detection, 24-hour outage logs, and allows users to see response time, uptime, SSL expiration, status, response size, and response code.
etherphiscState
cState is an open-source static status page with fast loading times, easy incident creation, and adaptability. It supports multiple languages and offers free hosting.
It allows users to link incidents to systems/categories and provides statistical calculations. However, it does not support automatic monitoring out of the box. It is ideal for recording incidents as it does not need to be updated in real time.
cstate