31 Free React Data Visualization and Chart Libraries

As a React developer, there's a high probability that you've encountered scenarios where you needed to incorporate some form of visualization into your applications. This could be anything from simple graphs to complex interactive visuals. The question then arises - which library should you choose for this task?
In this long post, we delve into an extensive list of some of the most popular, feature-rich React charting and visualization libraries currently available.
These libraries can empower any React developer to enhance their applications with intricate, data-rich visuals.
If you are looking for React map library for your project, we invite you to check this post: 16 Free React Map Libraries for Google Maps, Leaflet, and SVG Maps.
Whether yAnalyticsou're creating a simple pie chart or a complex, interactive data visualization, these libraries offer a multitude of options to suit your needs.
1. React Charts
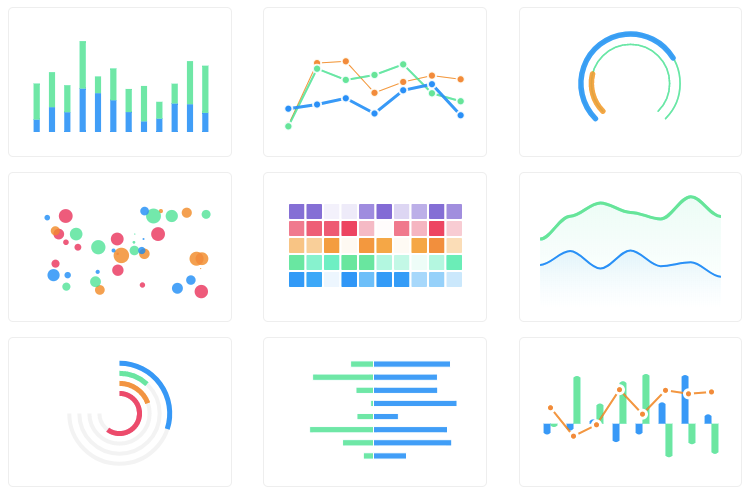
React Charts is a developer-friendly charts library for React. It is popular among React developers not just because it is easy to use, but also because it is a lightweight library with dozens of examples and it is responsive interface.
Key Features
- Line Charts
- Bar Charts
- Column Charts
- Bubble Charts
- Area Charts
- Axis Stacking
- Inverted Axes
- Hyper Responsive
- Invisibly Powered by D3
- Declarative
- Mutliple Axes
 TanStack
2. React Apexcharts
This is a React.js wrapper for ApexCharts to build interactive visualizations in React.
apexcharts3. React Frappe Charts
React Frappe Charts is a React wrapper for Frappe Charts that includes TypeScript definitions and a Storybook playground. It supports Next.js, Astro and several other React-based frameworks.
sheshbabu4. React Chartjs 2
React-chartjs-2 is a robust collection of React components designed specifically for Chart.js, a renowned charting library. It confidently supports both Chart.js versions v4 and v3.

 reactchartjs
5. Recharts
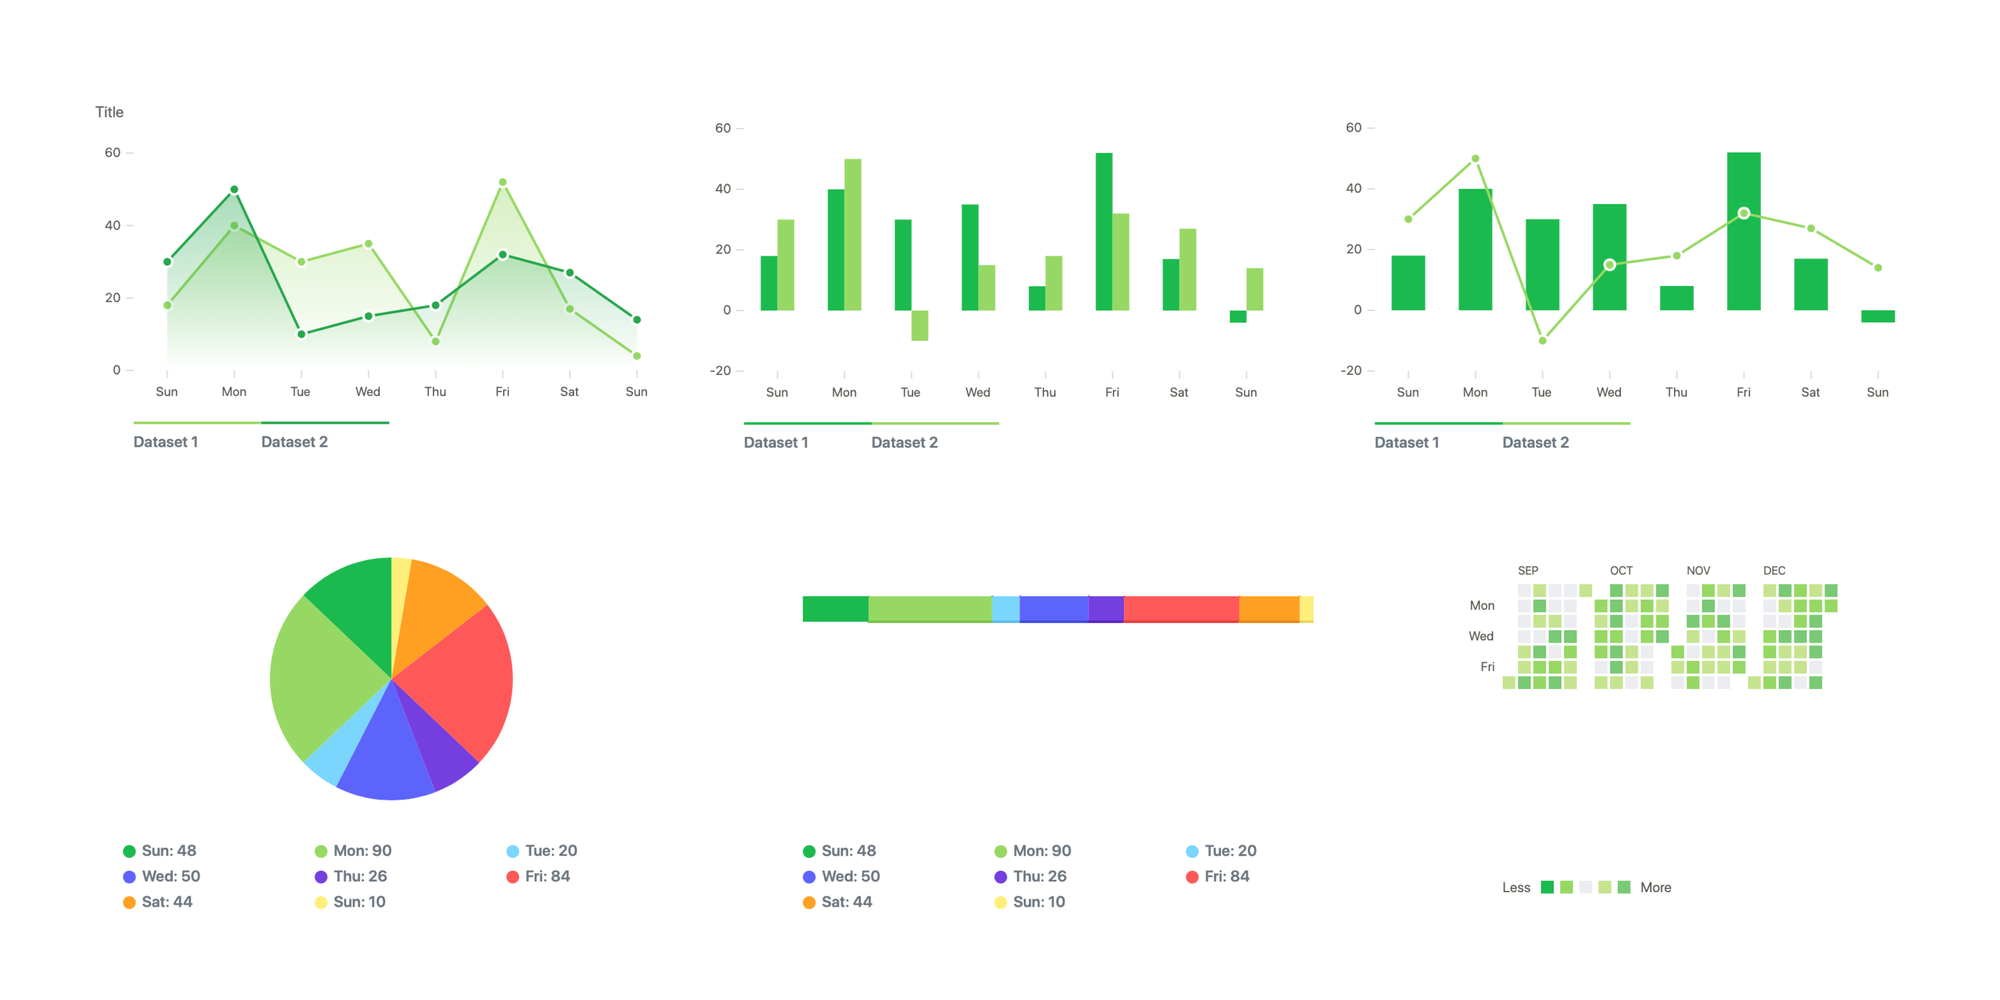
Recharts stands as a premier chart library, specifically designed for React applications. Constructed with utmost precision using React and D3, it revolutionizes chart creation in React applications.
Its cornerstone principles include seamless deployment with React components, superior native SVG support with a light footprint of dependencies on selected D3 submodules, and the strength of declarative, purely presentational components.
<LineChart width={400} height={400} data={data} margin={{ top: 5, right: 20, left: 10, bottom: 5 }}>
  <XAxis dataKey="name" />
  <Tooltip />
  <CartesianGrid stroke="#f5f5f5" />
  <Line type="monotone" dataKey="uv" stroke="#ff7300" yAxisId={0} />
  <Line type="monotone" dataKey="pv" stroke="#387908" yAxisId={1} />
</LineChart>6. React Vis
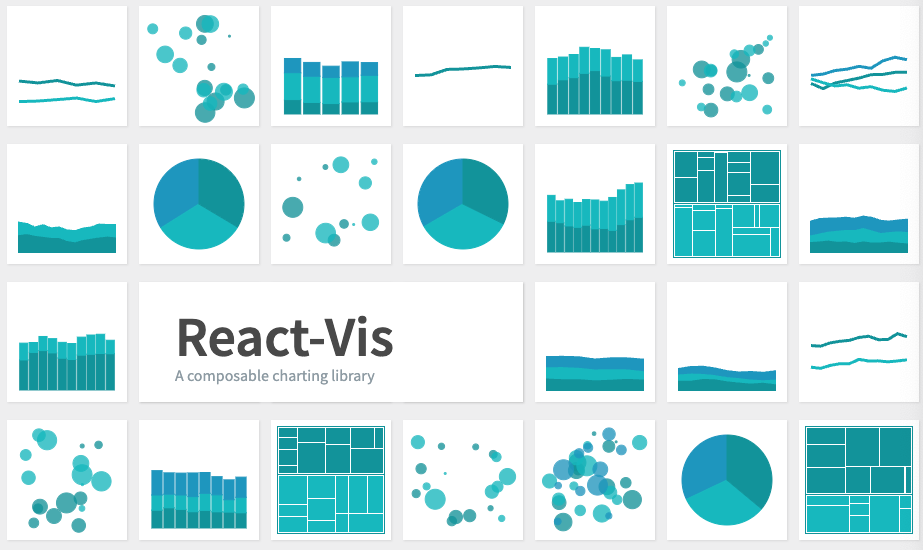
React-vis, developed and maintained by Uber, confidently stands as a robust collection of React components designed to render an extensive range of common data visualization charts.
This includes, but is not limited to, line/area/bar charts, heat maps, scatterplots, contour plots, hexagon heatmaps, pie and donut charts, sunbursts, radar charts, parallel coordinates, and tree maps. With React-vis, creating complex and visually stunning visualizations is not just easy, it's a guarantee.
7. React Timeseries Charts
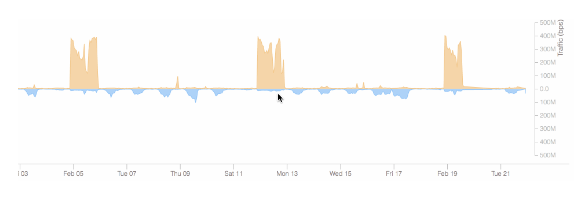
React Timeseries Charts stands as a robust, modular charting library specifically tailored for React, designed with the express purpose of visualizing timeseries and network traffic data. It strategically uses d3 for intricate, low-level elements and React for unmatched high-level composability.
This library proudly offers features such as a declarative layout, engaging interactivity, multiple axes and rows, a diverse array of chart types, brushing capabilities, detailed legends, and overlay markers.
esnet8. React Spectrum Charts
React Spectrum Charts is a cool charting library for React. It's all about making awesome charts without writing a ton of code, and it sticks to Adobe's design rules.
Plus, it's got responsive charts that look great on different screen sizes and orientations, so it's a breeze for users on any device.
adobe9. REAVIZ
REAVIZ is this cool chart component library that totally gets React for rendering the components, but uses D3js for all the number crunching. It's a breeze to start creating charts with it, and you still get to customize to your heart's content.
Features and included charts
Chart types include:
- Bar Chart
- Single Series Vertical / Horizontal
- Multi Series Vertical / Horizontal
- Stacked Vertical / Horizontal
- Stacked Normalized Vertical / Horizontal
- Stacked Diverging Vertical / Horizontal
- Marimekko
- Radial
- Sparkline
- Waterfall
- Line Chart
- Single Series
- Multi Series
- Stacked
- Stacked Normalized
- Radial
- Sparklines
- Area Chart
- Single Series
- Multi Series
- Stacked
- Stacked Normalized
- Radial
- Sparklines
- Scatter Chart
- Linear
- Radial
- Pie Chart
- Standard
- Exploded
- Donut Chart
- Sankey chart
- Gauge
- Radial
- Linear
- Stacked Radial
- Map Chart
- Heatmap
- Standard
- Year Calendar
- Month Calendar
- Venn Diagram
- Standard
- Euler
- Fixed Euler
- Bubble Chart
- Treemap
- Bar List
- Meter
- Spider / Radar
- Funnel Chart
Additional features:
- Legend
- Discrete
- Sequential
- Axis
- Linear
- Radial
- Advanced Label Positioning
- Gestures
- Pinch
- Pan
- Zoom
- Move
- Tooltip
- Single Value
- Grouped Values
- Line/Area Series Symbols
- Animations Enter/Update/Exit
- Brush
- Patterns
- Gradients
- Grid Lines
- Mark Lines
- BigInt Support
- Auto Sizing
- Bar Guidelines
- Range Lines
- Animated Counts
- a11y Support for labels, roles and tabbing
- SSR
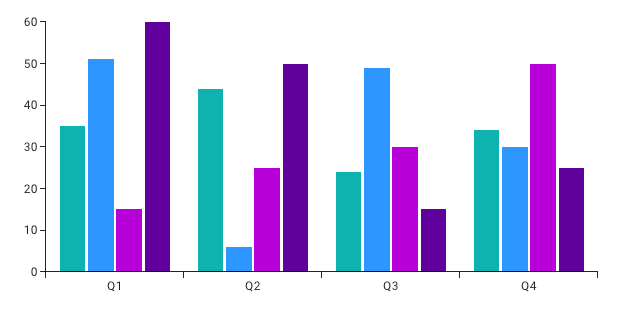
reaviz10. Amazing React Charts
Amazing React Charts confidently stands out as a simple yet powerful library for creating and managing canvas charts on the web. Leveraging the strength of echarts and the echarts-for-react wrapper, it's readily accessible as an NPM package.
nginformatica11. Three.js 3D for React
This is an open-source Three.js React's animation library are like the ultimate combo! They've got a WebGL renderer, camera, and scene components.
And the lighting? They've got it all - Ambient, Point, Directional - you name it. They've also got this cool thing called Mesh, which is all about triangular polygonal objects.
Then there's Buffergeometry, which is super handy for showing off lines, mesh, position, and face vertex in an efficient way. And let's not forget Material - it's all about making your objects look good.
auralshin12. React Chrono

React Chrono is a free, open-source timeline component for React. It offers three timeline modes, a slideshow mode, and features for displaying images and videos. It supports keyboard interaction, custom content rendering, nested timelines, and a data-driven API.
Features
- Offers three timeline display modes: horizontal, vertical, and alternating vertical
- Includes a slideshow mode for automatic timeline playback
- Capable of seamlessly incorporating images and videos into the timeline
- Supports keyboard interactions for accessibility
- Allows for easy rendering of custom content
- Can handle nested timelines
- Provides a data-driven API for advanced use
- Offers easy color customization
- Supports the use of custom icons within the timeline
- Constructed using TypeScript for robustness
- Styled using the Emotion library for a polished look
prabhuignoto13. React Timeline Editor
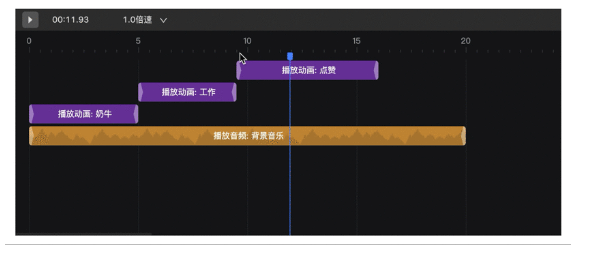
The React Timeline Editor is a highly versatile react component, primarily designed to facilitate the swift and efficient construction of a timeline animation editor.
This powerful component is perfectly suited for developers who are seeking to create engaging and dynamic animations within a timeline format. Its intuitive design ensures a user-friendly experience, making it an ideal tool for both beginners and seasoned developers alike.
xzdarcy14. dnd-timeline
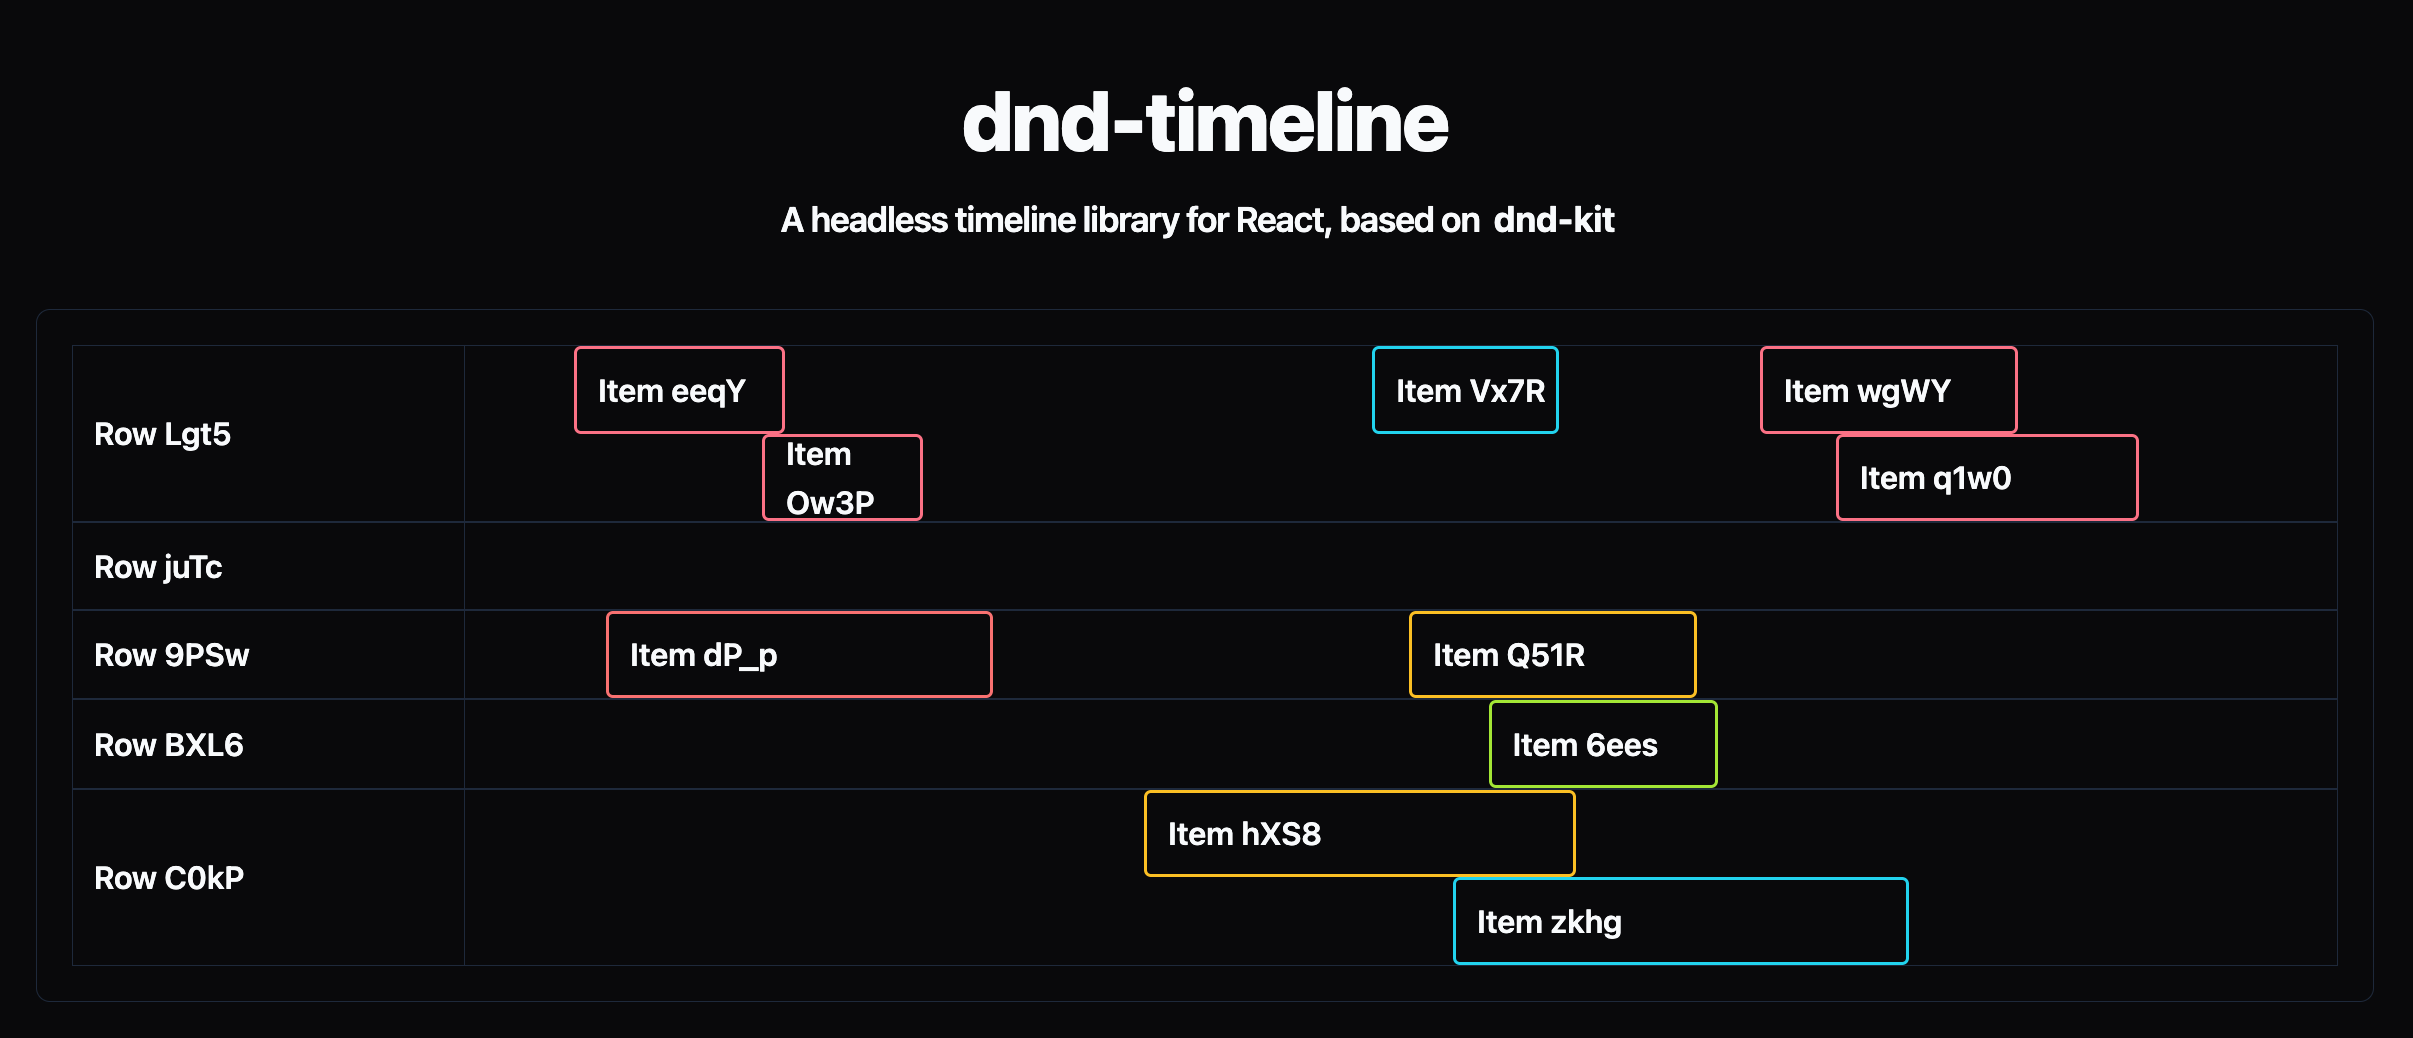
dnd-timeline (drag-and-drop) isn't just another headless timeline library; it's the ultimate solution, based on the formidable dnd-kit. With an innovative hook-based architecture featuring useItem and useRow, it guarantees flexibility and top-notch performance.
Free from unnecessary styling, it is fully adaptable to any styling and functional libraries of your choice. Superior efficiency is ensured as it only renders when absolutely necessary, leveraging CSS transformations for intermediate states and animations.
Plus, it effortlessly supports RTL natively.
Features
- Stacking Rows: Allows for items with intersecting relevance to be stacked in a single row.
- Grid Snap: Automatically fits items into a predefined grid upon dropping them, with adjustable grid size.
- Display Time Axis: Offers the option to display a time axis with variable markers based on zoom level.
- Time Cursor Display: Provides an optional time cursor that shows the current time on the timeline.
- Pan and Zoom: Enables zooming and panning using specific mouse wheel and keyboard combinations.
- Dynamic Row and Item Disabling: Allows for the disabling of rows and items based on user-defined criteria.
- DnD Integration: The timeline can be integrated with other Drag-and-Drop interactions in the app for moving items in and out of the timeline.
samuelarbibe15. React Calendar Timeline
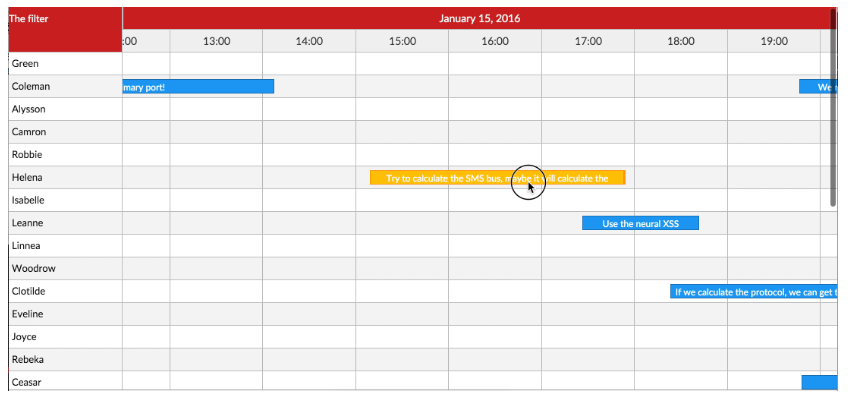
This is an open-source, modern, and responsive timeline component that has been meticulously designed and developed using React, a popular JavaScript library.
It takes full advantage of React's flexibility and efficiency, ensuring a seamless user experience and high performance.
This timeline component can be easily integrated into any project, providing a visually pleasing and intuitive way to display chronological events.
namespace-ee16. React d3 Graph
React-d3-graph is a tool for building interactive and configurable graphs with React and D3 effortlessly.
danielcaldas17. React Dynamic Charts
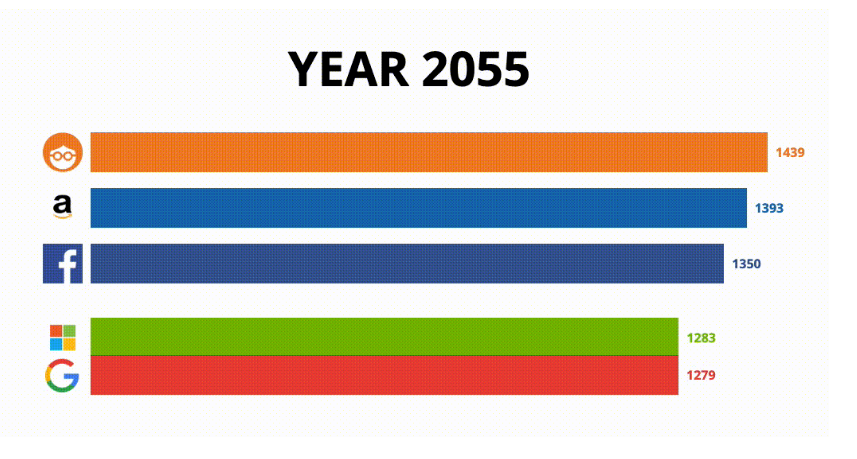
React-dynamic-charts is the definitive React library for crafting animated chart visualizations driven by dynamic data.
dsternlicht18. Griff React
Griff-react is an unrivaled charting tool for time series, built specifically for handling dynamic data. Utilizing React for rendering and d3 for event-handling and mathematics, it stands at the forefront of its field.
With its innovative dynamic data loading feature, Griff-react effortlessly fetches data based on input parameters, revolutionizing the display of complex time series.
cognitedata19. React planner
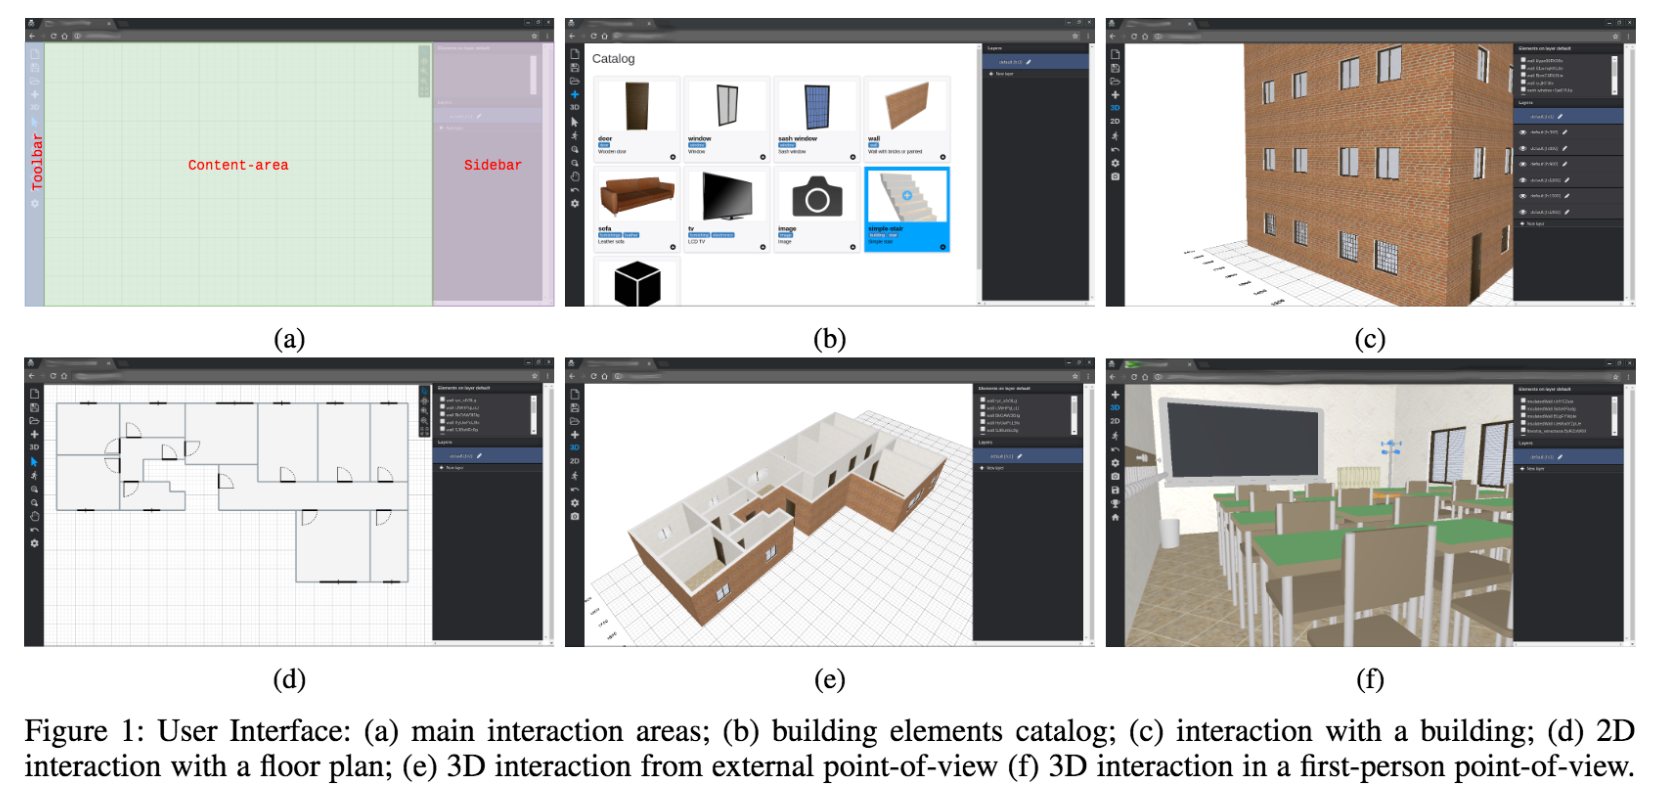
react-planner is an authoritative React component, designed for crafting model buildings with ease and precision. With the convenience of drag & drop from a catalog bursting with customizable, ready-to-use objects, you can effortlessly transition from 2D wireframes to 3D models.
As a developer, you have the power to enhance your users' experience by expanding the catalog with new objects.
cvdlab20. React Digraph
React-digraph is a React component that simplifies the creation of a directed graph editor by handling the SVG drawing and event handling logic.
uber21. VChart
VChart is a robust and dynamic charting component library that forms a vital part of the VisActor visualization system. This library encapsulates the charting logic based on the powerful visual grammar library, VGrammar. Alongside this, it also includes component encapsulation that is based on the cutting-edge visual rendering engine, VRender. The core capabilities of VChart are multifaceted and are as follows:
Cross-platform functionality: VChart is designed to be versatile and adaptable. It automatically adjusts to various platforms, including desktop environments, H5, and numerous small program environments. This cross-platform functionality ensures a seamless and consistent user experience, irrespective of the device or platform used.
Storytelling: VChart incorporates a comprehensive range of annotation, animation, flow control, narrative templates, and other enhanced features. These are all aimed at facilitating and enhancing visual storytelling, thereby enabling users to create compelling narratives and visual presentations.
Scenes: One of the key objectives of VChart is to deliver visual storytelling capabilities directly to the end-users. By doing so, it aims to significantly unlock and boost developer productivity, thereby streamlining the development process and fostering innovation.
VChart supports many libraries and frameworks as React, Taro, Lark, WX, and more.
VisActor22. MUI X Charts
MUI X Charts is the go-to choice for data visualization, boasting a fast and extendable library of React chart components. Relying on D3.js for data manipulation and SVG for rendering, it provides unparalleled customization options.
From single components with defaults, to extensive configuration props, and subcomponents for flexible composition, MUI X Charts has got you covered. Plus, it integrates seamlessly with other MUI System tools, ensuring an effortless workflow.
23. Webgl React
Webgl-react is a React library for 2D rendering in WebGL using screen coordinates. It is designed to handle the drawing of large numbers of shapes in a single draw call, which can be a heavy process in React.
It uses different shaders for different shapes, and users can write their own shaders if needed.
ryohey24. React Canvas SketchPad
This is a React component for creating sketches, developed with React, TypeScript and Vite. It offers features such as drawing a path, undoing a path, and downloading sketches as PNG or Paths in JSON format. The documentation is created using Storybook.
jason-nordheim25. React Canvas Map
This tiny library offers a 2D Map Library for React Cavanvas.
Bucky2426. React Scatter Board
This is a React implementation of THREE.js 2d/3d scatter plot. This library was created using the create-react-library CLI.
MaayanLab27. Konva.js
Konva is an HTML5 Canvas JavaScript framework that enables high performance animations, transitions, node nesting, layering, filtering, caching, event handling for desktop and mobile applications, and much more.
Features
- Object Oriented API supporting numerous shapes
- Compatibility with both desktop and mobile devices
- Inclusion of animations and tweens
- Node nesting, grouping, and event bubbling
- High-quality exports into data URLs, image data, or image objects
- Accessible, ready-to-use filters
- Native integration with web frameworks like React, Vue, and Svelte
- Built-in Drag & drop support

28. React Handy Renderer
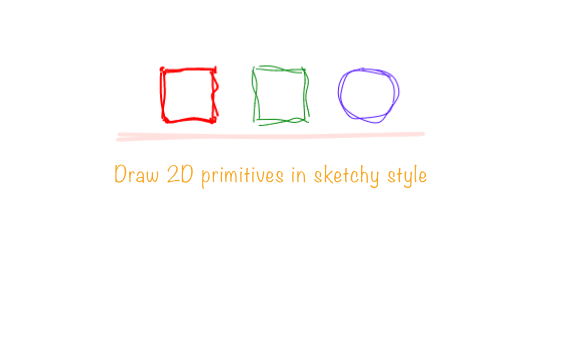
This small library enables you to draw simple primitive shapes with sketchy style with React.
nitin4229. Isometric
Isometric is a free and open-source A lightweight JavaScript library written in TypeScript to create isometric projections using SVGs. It can be added easily and used within React and React Native frameworks.
elchininet30. React Svg World Map
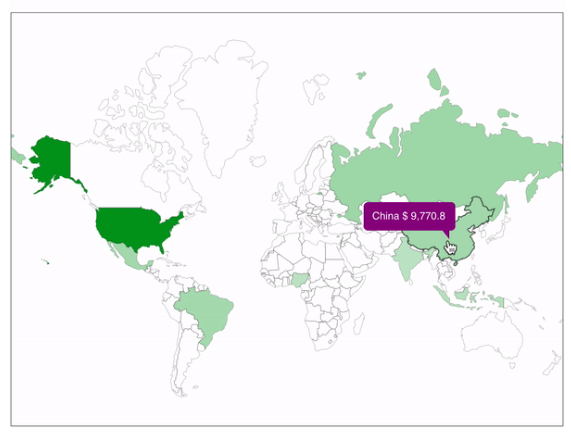
This is a free and open-source simple, compact and free React SVG world map.
Features
- Draw countries on a world map.
- Free - Really free with no limits.
- No registration - It is just a pure react component.
- No internet dependency - All the data is local, no calls to a back-end server.
- Easy to learn, easy to use, easy to customize.
yanivam31. React SVG Pan Zoom

react-svg-pan-zoom is a React component that adds pan and zoom features to the SVG images. It helps to display big SVG images in a small space.
Features
This component can work in four different modes depending on the selected tool:
- With the tool pan the user can move the image and drag it around within the viewer, but can't interact with SVG child elements.
- With the tool zoom the user can scale the image either with a point click or selecting a region to zoom the specified area, but can't interact with SVG child elements.
- With the tool none the user can interact with SVG child elements and trigger events.
- With the tool auto the user can interact with SVG child elements, perform pan (dragging the image), zoom in (double click), zoom out (double click + shift).
chrvadala