9 Open-source Self-hosted Logging and Monitoring Systems for DevOps Teams
Why Every DevOps Team Needs Observability (And the Tools That Make It Work)

Deploying code is just the beginning. The real test comes when your app goes live, especially if it’s running in the cloud, split across Microservices, or containerized with Docker and Kubernetes. Suddenly, you’re not just writing software; you’re managing a living system that can break in ways you never saw coming.
That’s where observability isn’t just helpful, it’s essential.
You’ve probably heard of tools like Grafana, SigNoz, Netdata, Jaeger, or Graylog. But they’re more than just dashboards or log viewers. They’re your eyes and ears into what’s really happening inside your systems, especially when things go sideways.
Think about it: you get an alert that a service is slow. You check the logs. Nothing obvious. You look at CPU usage. Everything looks fine.
Then you realize, you’re missing the full picture. That’s where the three pillars of observability come in: metrics, logs, and traces.
- Metrics tell you what’s happening (e.g., CPU spikes, request latency).
- Logs show you why it happened (e.g., an error message, a failed connection).
- Traces map how a single user request flows through multiple services, critical when debugging performance issues in distributed apps.
Open-source Self-hosted Observability Solutions
1- SigNoz
SigNoz is a free, open-source observability platform built natively on OpenTelemetry, offering unified monitoring of logs, metrics, and distributed traces in a single application.
It serves as a cost-effective alternative to commercial tools like Datadog and New Relic, enabling teams to monitor application performance, detect issues proactively, and troubleshoot downtime efficiently with full contextual insights. Designed for modern cloud-native environments, SigNoz supports real-time visibility across microservices and containerized systems.
SigNoz, included features:
- Application Performance Monitoring (APM)
Out-of-the-box charts for p99 latency, error rate, Apdex, and RPS. Monitor services, databases, and external calls. - Logs Management
Centralized log storage using high-performance ClickHouse. Instant search with filters & query builder. Create visual dashboards from logs. - Distributed Tracing
Trace requests across microservices via OpenTelemetry. Visualize traces with Flamegraphs & Gantt Charts. Drill down into spans for root cause analysis. - Metrics & Dashboards
Ingest metrics from apps and infrastructure. Build custom dashboards with diverse panel types (time-series, bar, pie, etc.). Use a powerful query builder with formula support. - Alerts
Set alerts on logs, metrics, or traces. Define thresholds, use anomaly detection, and configure notification channels. Track alert history for better incident management. - Exceptions Monitoring
Auto-capture exceptions in Python, Java, Ruby, JavaScript. Add custom context. View full stack traces and enrich data with user/session attributes.
2- Dozzle
Dozzle is a lightweight, self-hosted container logging and monitoring tool that provides real-time Docker logs directly in your browser. It supports Docker, Swarm, Kubernetes, and Podman, with secure remote host access via agents.
Included features are:
- Self-hosted & private
- Real-time Docker logs
- Browser shell access
- Multi-host support
- SQL log queries (DuckDB)
- Secure agents for remote hosts
- Docker Swarm, Kubernetes, Podman compatible
- Open source & free
3- Netdata
Netdata is an open-source, real-time infrastructure monitoring tool that delivers per-second metrics with zero configuration. It offers instant insights, ML-powered anomaly detection, and predictive alerts, all while using minimal resources.
Fully secure and distributed, Netdata keeps your data local, making it ideal for monitoring servers, containers, and cloud environments at scale, without relying on centralized collection or complex setups.
Netdata include a cool set of features, that makes it the best choice for DevOps, and agencies:
- Real-Time Monitoring: Per-second metrics with instant visual feedback.
- Zero Configuration: Automatically detects and monitors all system components.
- ML-Powered Anomaly Detection: Unsupervised machine learning models detect issues at the edge.
- Long-Term Retention: Efficient storage (~0.5 bytes per sample) with tiered archiving.
- Advanced Visualization: Interactive, drill-down dashboards without query language.
- Extreme Scalability: Native horizontal scaling via Parent-Child architecture.
- Complete Visibility: Unified view across infrastructure, containers, and applications.
- Edge-Based Processing: Data analyzed locally; no central collection or cloud dependency.
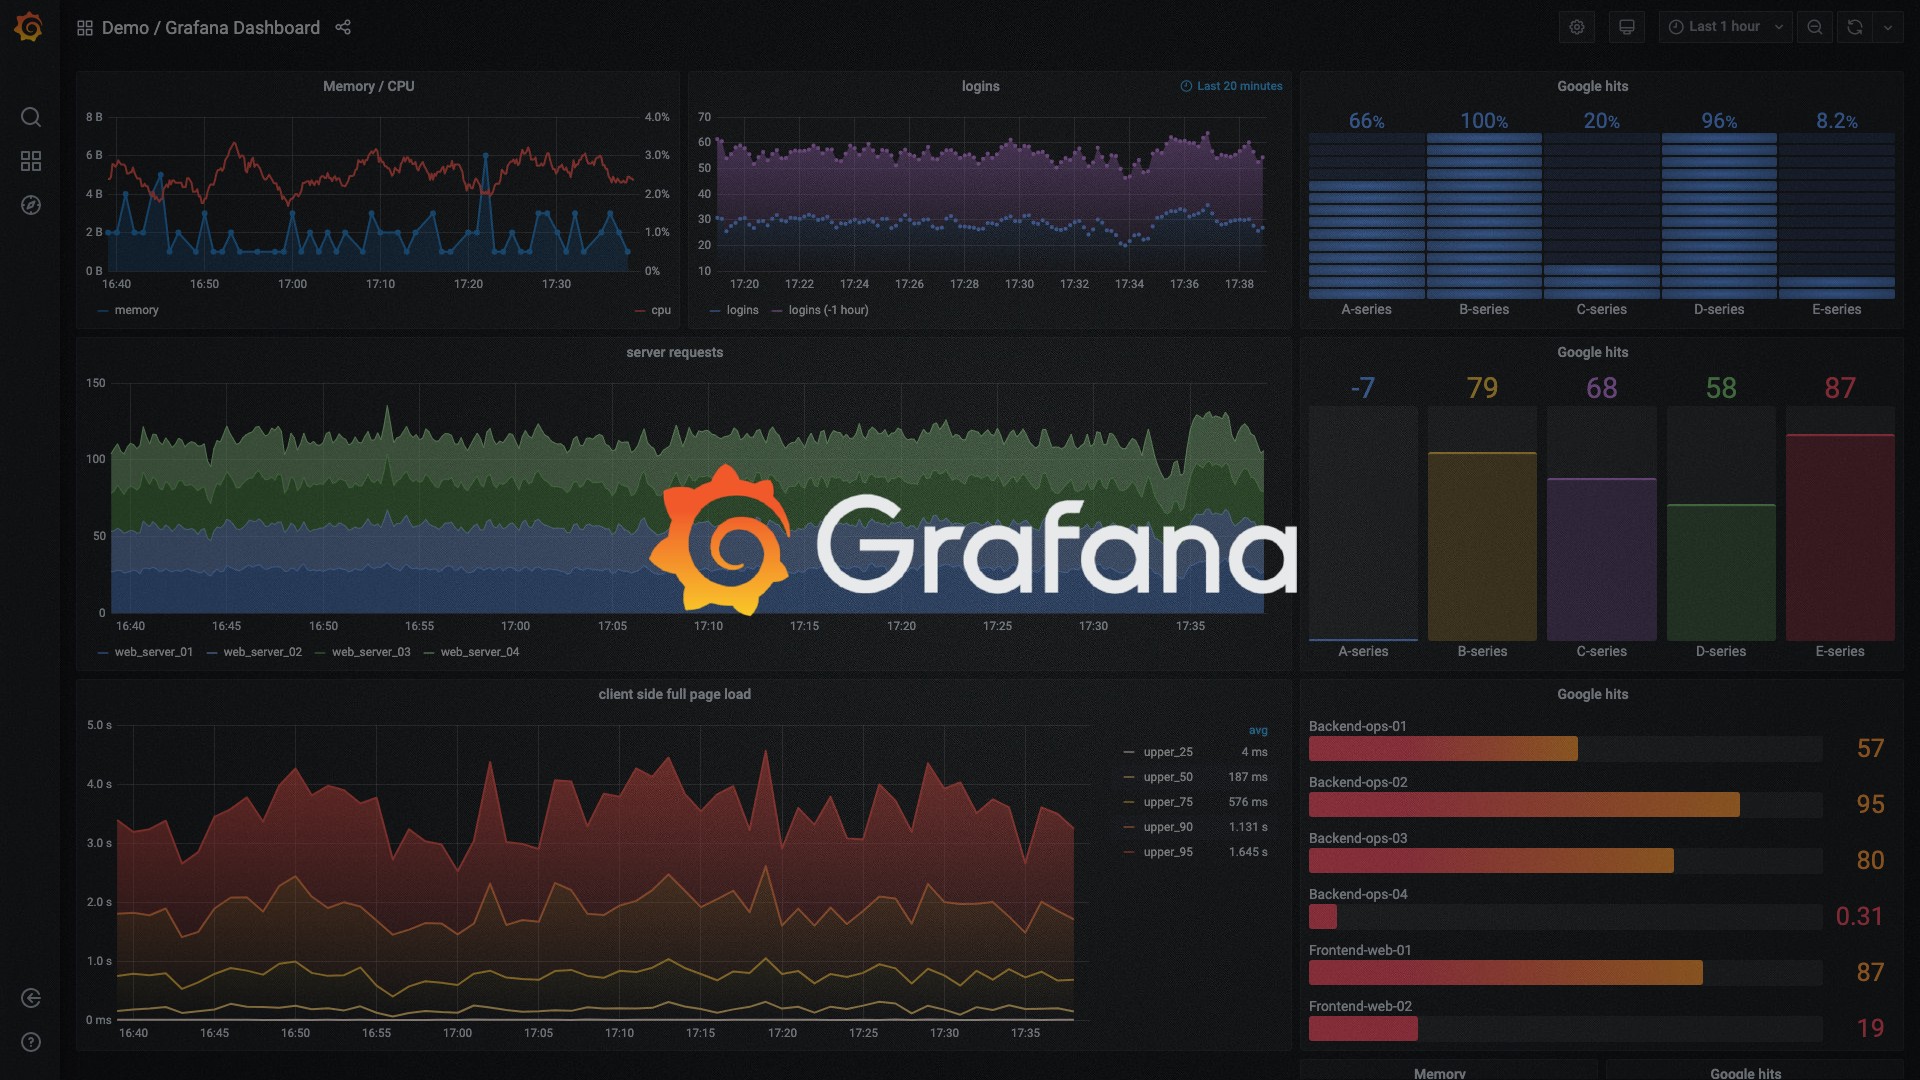
4- Grafana
Grafana is an open-source platform for monitoring, querying, visualizing, and alerting on metrics from any data source. It enables teams to create, explore, and share interactive dashboards with rich visualizations, using time-series graphs, heatmaps, tables, and more.
With dynamic dashboards powered by template variables, users can build reusable, flexible views that adapt to different contexts. Grafana fosters a data-driven culture by making it easy to turn raw data into actionable insights, regardless of where it’s stored.
Grafana Other Features:
- Explore Metrics: Ad-hoc queries, dynamic drilldown, split view for comparing time ranges, queries, and data sources.
- Explore Logs: Instant switch from metrics to logs with preserved filters; live streaming and full-text search.
- Visual Alerting: Create alerts visually, auto-trigger notifications to Slack, PagerDuty, VictorOps, OpsGenie, etc.
- Mixed Data Sources: Combine multiple datasources in one panel, select source per query, including custom ones.
5- Glances - An Eye on your System
Glances is a lightweight, open-source system monitoring tool built for real-time visibility across Linux, macOS, and Windows. With a clean, intuitive dashboard, it delivers instant insights into CPU, memory, disk, network usage, running processes, temperatures, voltages, fan speeds, and more, perfect for developers, sysadmins, and DevOps engineers who value simplicity and speed.
Whether you're managing a single server or multiple systems, Glances supports Docker and LXC container monitoring, giving you full control over your infrastructure’s health.
6- Graylog
Graylog is a powerful, open-source log management and security monitoring platform designed for modern IT and security teams. It centralizes logs from servers, applications, networks, and cloud environments, offering real-time analysis, advanced search, and intelligent alerting.
With features like AI-powered anomaly detection, UEBA, SOAR integration, and customizable dashboards, Graylog helps teams detect threats faster, streamline investigations, and maintain compliance.
7- Jaeger
Jaeger is a 100% open-source, cloud-native distributed tracing platform. As a developer, I use it to trace requests across microservices, identify latency bottlenecks, debug failures, and visualize service dependencies—making observability in complex systems fast, reliable, and transparent.
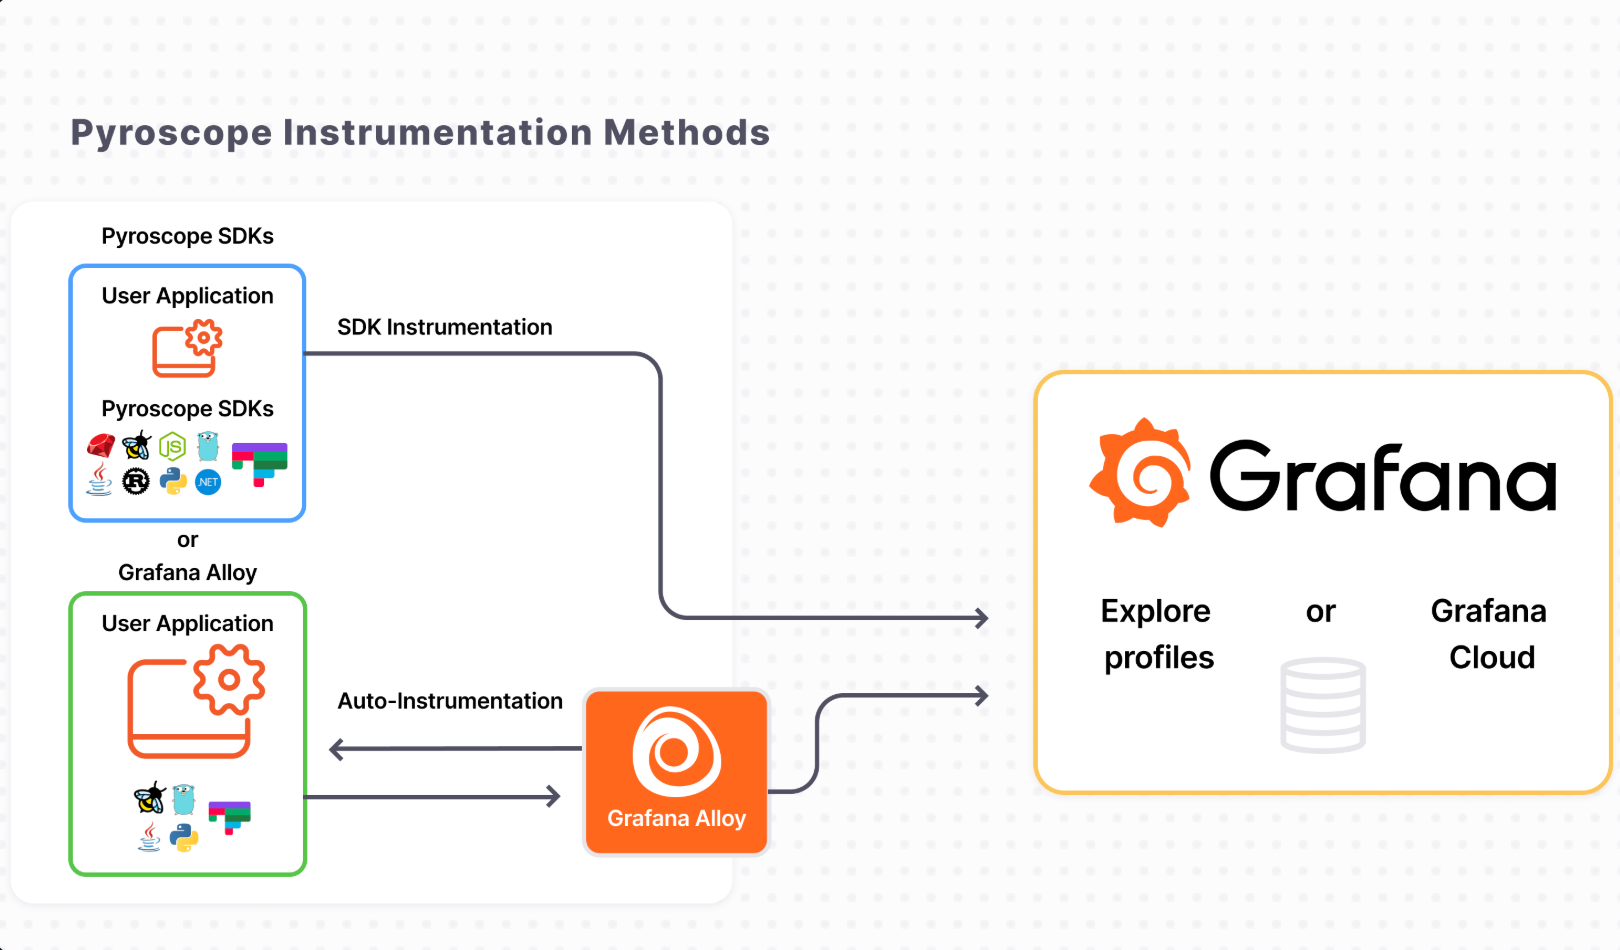
8- Pyroscope
Grafana Pyroscope is a continuous profiling platform designed to surface performance insights from your applications, helping you optimize resource usage such as CPU, memory, and I/O operations. With Pyroscope, you can both proactively and reactively address performance bottlenecks across your system.
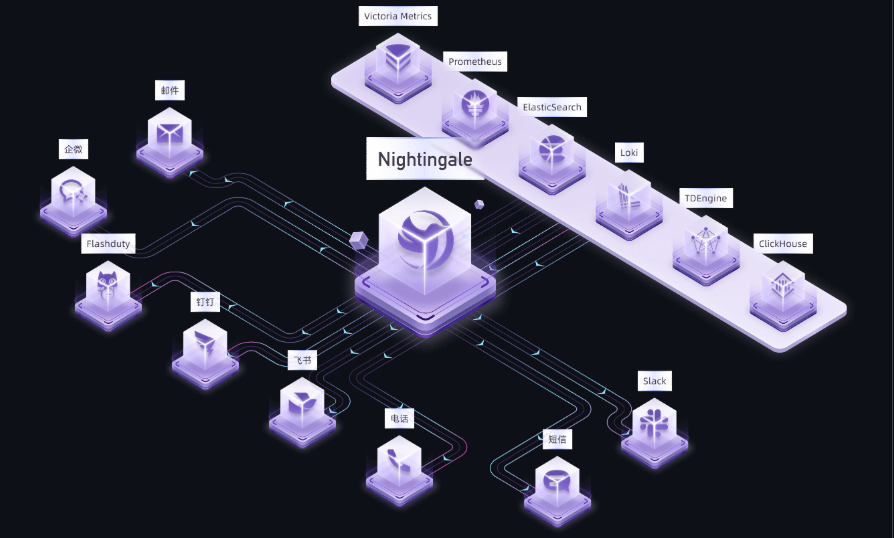
9- Nightingale
Nightingale is yet another open-source monitoring platform focused on powerful, intelligent alerting. Like Grafana, it integrates with diverse data sources, but while Grafana excels in visualization, Nightingale prioritizes a robust alerting engine, enhancing alarm processing, correlation, and distribution to help teams respond faster and more effectively to critical issues.

Now, let’s talk about who actually uses these tools, and why they’re not just for “big companies.”
For Developers & Engineers: Stop Guessing, Start Knowing
If you’re building apps with modern stacks, especially microservices, you need to see beyond the surface.
- SigNoz pulls all three pillars together using OpenTelemetry, so you don’t have to stitch together different tools. It’s like having a unified command center.
- Grafana doesn’t just display data, it helps you understand it. With custom dashboards, you can track everything from API response times to database query load.
- Netdata gives you instant feedback right on your terminal. Need to know if your server’s memory is spiking during deployment? Netdata shows it in real time, no setup required.
- Jaeger is a game-changer when your app spans 10+ services. Want to trace a single user request from frontend to backend? Jaeger maps it step-by-step.
These aren’t fancy toys, they’re lifesavers when you’re trying to fix something before users notice.
For DevOps & SREs: Less Panic, More Control
As someone keeping systems stable, you don’t want to be firefighting every day.
- Dozzle is simple but powerful: a real-time web view of Docker container logs. No CLI gymnastics. Just open the browser, see the logs, act fast.
- Graylog centralizes logs from everywhere, servers, containers, APIs, so you can search, analyze, and even set up alerts for suspicious patterns. Perfect for security monitoring and compliance.
- pyroscope does something most tools miss: it profiles your code in production. Ever wonder why your service is using too much CPU? pyroscope shows you exactly which function is causing it.
Even Non-Dev Roles Can Benefit
System admins, ops leads, or team leads don’t need to write code, but they do need visibility.
- Glances is a lightweight, terminal-based tool that gives you a quick snapshot of system health, great for checking servers on the fly.
- Nightingale offers a modern, all-in-one approach to metrics and logs, especially useful in growing teams where consistency matters.
Real-World Use Cases
- A sudden spike in errors? Trace the request through Jaeger, find the failing service, and fix it before users complain.
- Slow API responses? Use pyroscope to spot inefficient code paths.
- Security alert triggered? Graylog helps you trace the source quickly.
- Onboarding new devs? Grafana dashboards make it easy to share what “normal” looks like.
Final Thought
Observability isn’t about adding more tools. It’s about reducing uncertainty. Whether you’re a solo developer or part of a large engineering team, knowing what’s happening in production isn’t optional, it’s how you build trust, reliability, and better software.
And yes—tools like SigNoz, Grafana, Netdata, and Jaeger aren’t just tech jargon. They’re practical, human-centered solutions for real problems.
You don’t need to be a wizard to use them. You just need to care about your system’s health, and that’s something every developer should.