AMI Medical Imaging (AMI) JavaScript ToolKit for building Web-based 2D/ 3D DICOM apps


AMI Medical Imaging (AMI) Toolkit is a JavaScript toolkit for building medical imaging DICOM-ready apps with 2D/ 3D visualization. It combines a set of JavaScript libraries & Three.JS for WebGL 3D rendering.
AMI Toolkit is featured in our list as one of medical imaging development tools that use WebGL for complex browser-based 3D/ 2D visualization. You can review our list 15 WebGL Medical Visualization Projects.
AMI toolkit is developed by Fetal-Neonatal Neuroimaging Developmental Science Center at Boston Children's Hospital, which has several developers & researchers, They have released several open source medical imaging projects available at their Github.
The project is currently in active development, its adding new set of functions and features on every major release. The developers provided a list of tutorials packed with code samples. AMI toolkit comes With simple one page tutorial at the README.md on how to use AMI, install the requirement Three.JS, & use the package manager/ build system, which is enough for experienced developers.
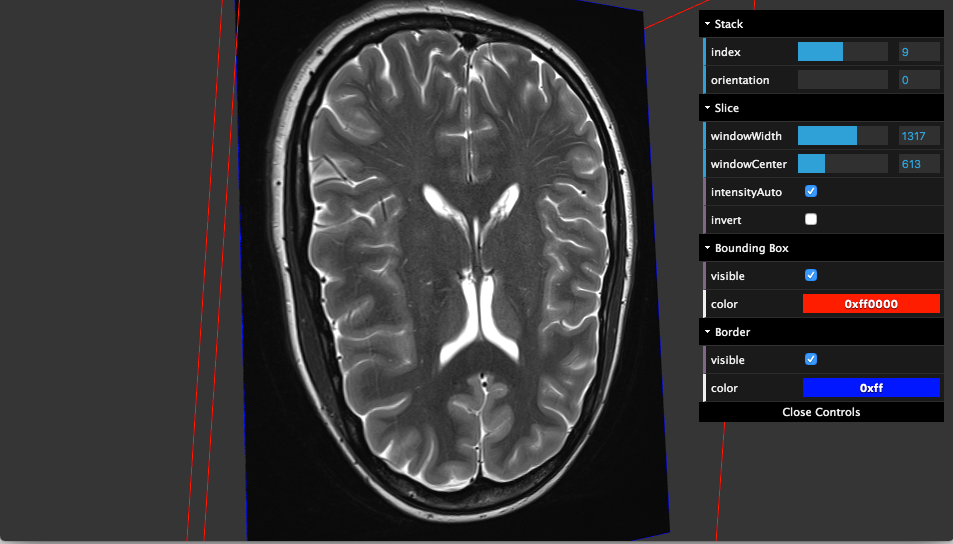
AMI Viewer
Ami-viewer takes an array of data organized by series/stacks/frames (provided by the Ami-loader and displays it.
Highlights
- Uses Three.js for WebGL rendering
- Uses The X Toolkit
- Lightweight
- Modern browser support
- WebGL-ready
- Online viewer with multiple layouts
- Works smoothly with The X Toolkit
Features
- Works in all modern browsers
- Easy to use for JavaScript developers
- Supports native DICOM extensions
- Supports 2D visualization
- 3D visualization
- Mesh rendering: VTK, STL, TRK, FSM.
- Volume rendering
- Surface rendering
- Lookup Tables
- Label Maps
- Nifti, NRRD, MHD/(Z), MGH/MGZ support
Demo & Tutorials
AMI Toolkit developers have provided a rich demo, tutorials with code snippets to ease understanding how it works with live examples:
- DICOM image loading
- Mesh rendering
- Label-map
- Volume rendering
- 3D DICOM visualization
- 2D Visualization
Under the hood
AMI Toolkit uses several libraries to provide a comprehensive medical imaging visualization framework:
- Three.js : 3D WebGL graphics engine for building 3D apps.
- The X Toolkit
- DICOMParser
- CornerstoneWADOImageLoader
- NIFTI-Reader-JS
- NRRD-JS
- JPEGLosslessDecoderJS
- Image-JPEG2000
- Pako
License
AMI Toolkit is released under MIT License.