22 Open-source Business Intelligence (BI) Dashboards

Business Intelligence, commonly known as BI, is the process of collecting, analyzing, and presenting data to make informed business decisions. BI helps organizations to transform their raw data into meaningful insights that can drive their business strategies. BI provides a range of advantages to organizations, including improved decision-making, increased efficiency, and better resource utilization.
BI Dashboards are an essential part of BI tools that provide a visual representation of complex data. A BI dashboard is a data visualization tool that displays KPIs, metrics, and other data points in an easy-to-understand format. Dashboards help organizations to track their performance in real-time and make informed decisions.
One of the significant advantages of using BI dashboards is that they provide real-time data visualization, allowing organizations to react to changing business conditions quickly. They offer a bird's-eye view of the organization's performance, enabling executives to make informed decisions.
BI dashboards provide several benefits, such as:
- Improved decision-making: BI dashboards provide real-time insights, allowing executives to make informed decisions.
- Increased efficiency: BI dashboards help organizations to save time by automating the process of data collection and analysis.
- Better resource utilization: BI dashboards provide insights into resource utilization, enabling organizations to optimize their resources.
Some common use-cases of BI dashboards include sales performance tracking, financial analysis, customer behavior analysis, and supply chain management.
Open-source BI dashboards are becoming increasingly popular due to their cost-effectiveness and flexibility. Some popular open-source BI dashboards include Apache Superset, Metabase, and Redash. These tools offer a range of features, including data visualization, data exploration, and data analysis.
In conclusion, BI dashboards are an essential part of any BI toolset, providing real-time insights into organizational performance. They offer several advantages, including improved decision-making, increased efficiency, and better resource utilization. Organizations can leverage open-source BI dashboards to achieve cost-effectiveness and flexibility.
Here, in this post, we offer you a comprehensive list of the best open-source and free BI dashboards, that anyone can download, setup, and use for free.
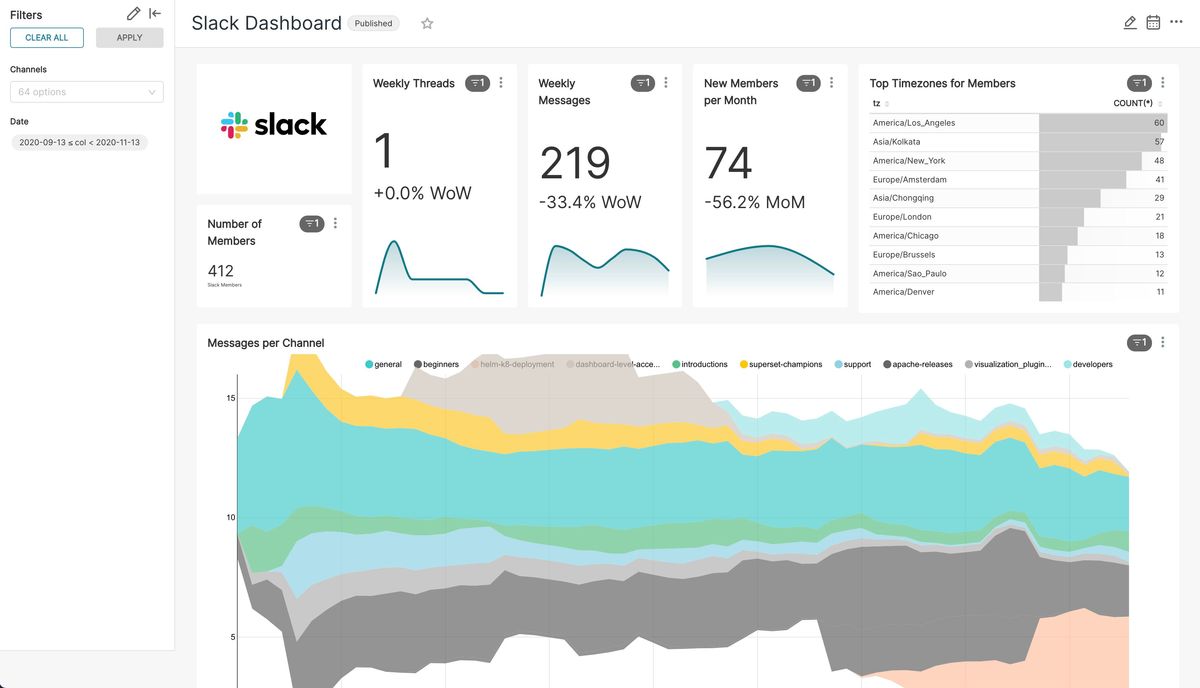
1- Apache Superset
Superset is a modern data exploration and data visualization platform. Superset can replace or augment proprietary business intelligence tools for many teams. Superset integrates well with a variety of data sources.
Superset provides:
- A no-code interface for building charts quickly
- A powerful, web-based SQL Editor for advanced querying
- A lightweight semantic layer for quickly defining custom dimensions and metrics
- Out of the box support for nearly any SQL database or data engine
- A wide array of beautiful visualizations to showcase your data, ranging from simple bar charts to geospatial visualizations
- Lightweight, configurable caching layer to help ease database load
- Highly extensible security roles and authentication options
- An API for programmatic customization
- A cloud-native architecture designed from the ground up for scale
 apache
2- Metabase

Metabase is the easy, open-source way for everyone in your company to ask questions and learn from data.
Metabase features include:
- Set up in five minutes (we're not kidding).
- Let anyone on your team ask questions without knowing SQL.
- Use the SQL editor for more complex queries.
- Build handsome, interactive dashboards with filters, auto-refresh, full-screen, and custom click behavior.
- Create models that clean up, annotate, and/or combine raw tables.
- Define canonical segments and metrics for your team to use.
- Send data to Slack or email on a schedule with dashboard subscriptions.
- Set up alerts to have Metabase notify you when your data changes.
- Embed charts and dashboards in your app, or even your entire Metabase.
 Hamza Mousa
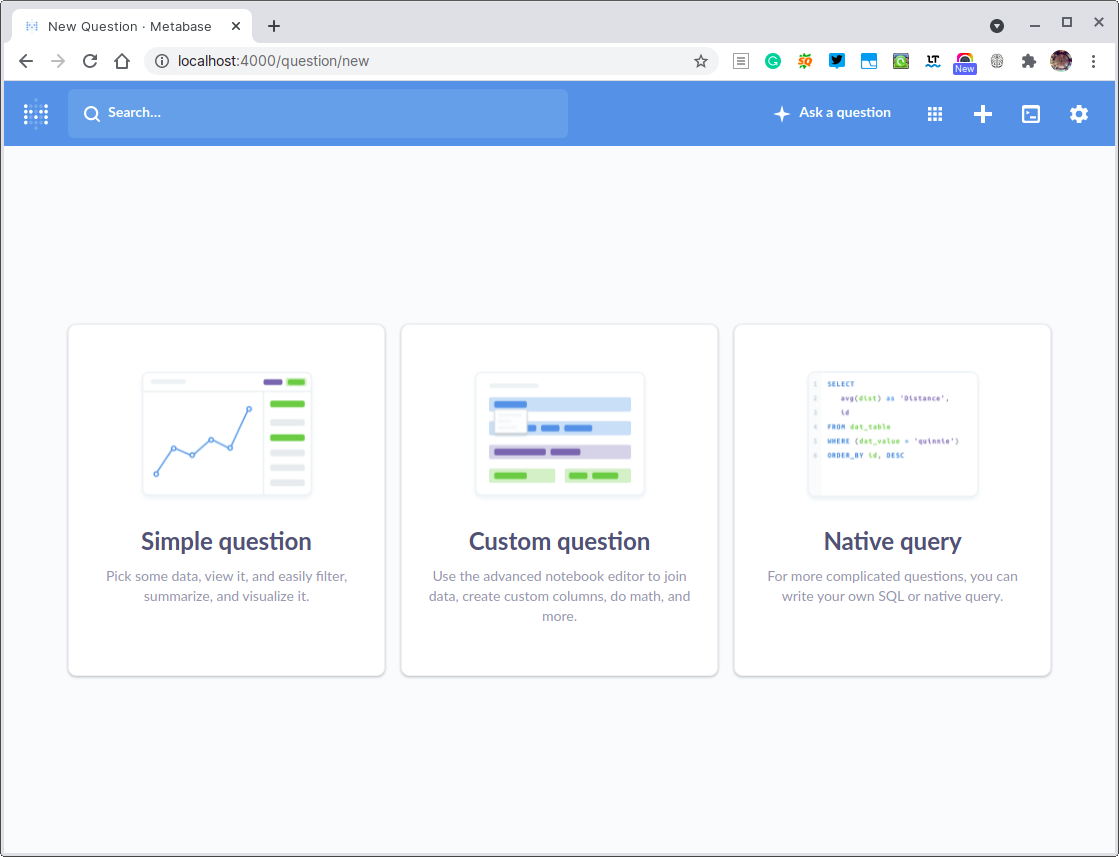
3- Redash
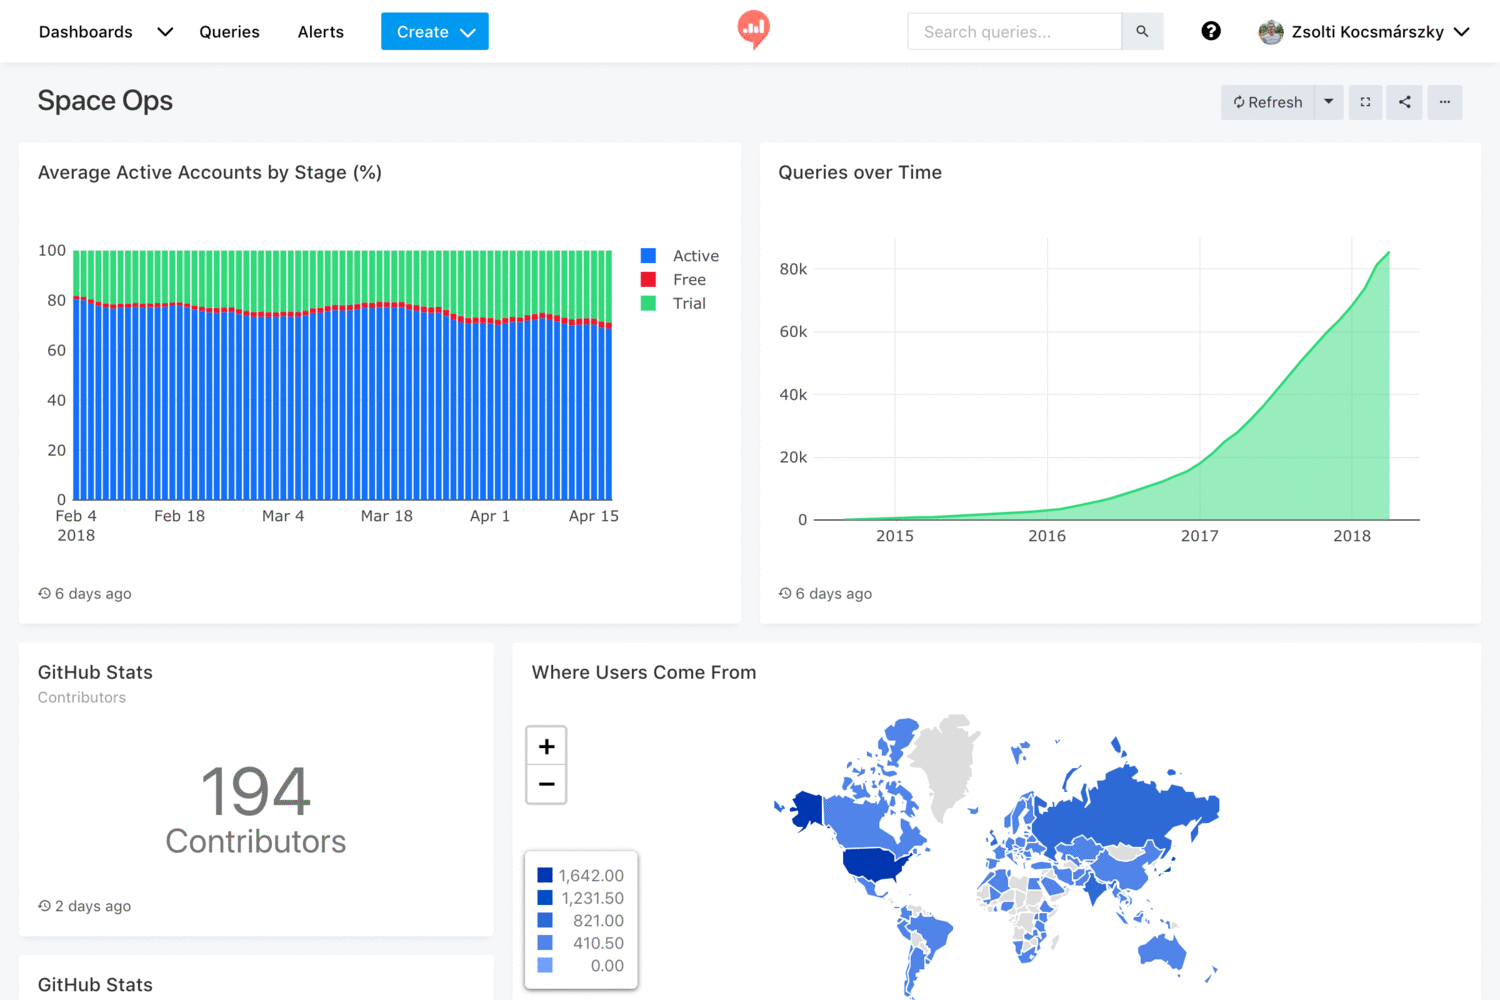
Redash is designed to enable anyone, regardless of the level of technical sophistication, to harness the power of data big and small. SQL users leverage Redash to explore, query, visualize, and share data from any data sources. Their work in turn enables anybody in their organization to use the data. Every day, millions of users at thousands of organizations around the world use Redash to develop insights and make data-driven decisions.
Redash features:
- Browser-based: Everything in your browser, with a shareable URL.
- Data sources: Dozens of different data sources that include many data file formats, databases, Hive, JIRA, MySQL, Apache Hive, InfluxDB, Oracle, and more.
- Ease-of-use: Become immediately productive with data without the need to master complex software.
- Query editor: Quickly compose SQL and NoSQL queries with a schema browser and auto-complete.
- Visualization and dashboards: Create beautiful visualizations with drag and drop, and combine them into a single dashboard.
- Sharing: Collaborate easily by sharing visualizations and their associated queries, enabling peer review of reports and queries.
- Schedule refreshes: Automatically update your charts and dashboards at regular intervals you define.
- Alerts: Define conditions and be alerted instantly when your data changes.
- REST API: Everything that can be done in the UI is also available through REST API.
- Broad support for data sources: Extensible data source API with native support for a long list of common databases and platforms.
getredash4- dbt
dbt is more than a dashboard solution for business intelligence, it enables data analysts and engineers to transform their data using the same practices that software engineers use to build applications.
Analysts using dbt can transform their data by simply writing select statements, while dbt handles turning these statements into tables and views in a data warehouse.
dbt-labs5- CBoard

CBoard is not only an analysis platform that supports interactive multidimensional report design and data analysis for user, but also a BI product development platform for developer.
Hamza Mousa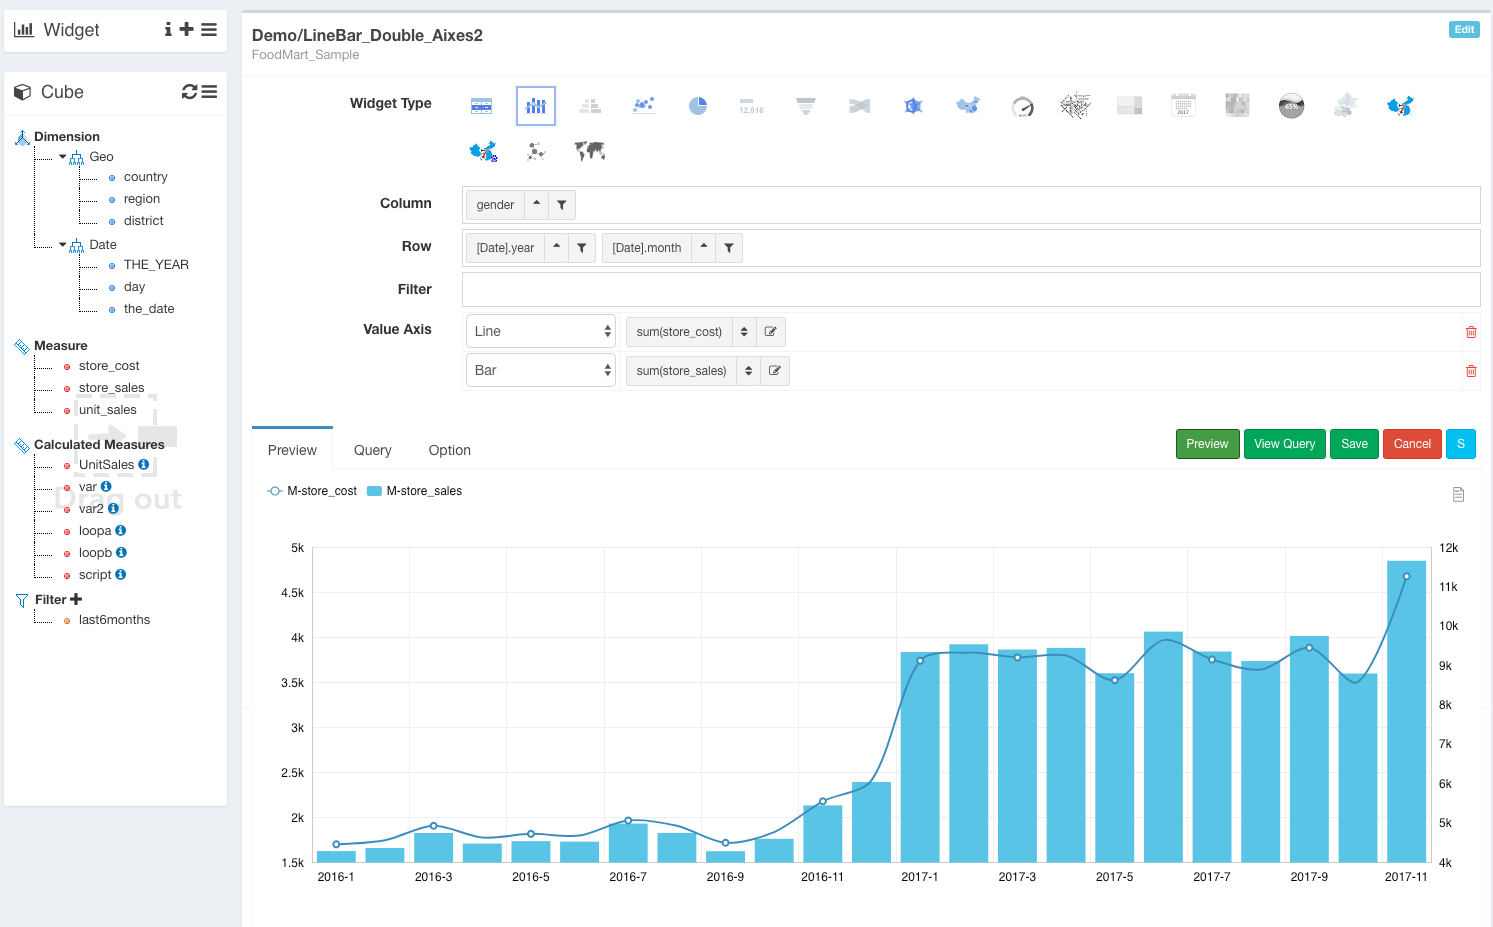 TuiQiao
6- Blazer
Blazer is an open-source self-hosted web dashboard that enables you to Explore your data with SQL. Easily create charts and dashboards, and share them with your team.
Blazer's features include:
- Multiple data sources - PostgreSQL, MySQL, Redshift, and many more
- Variables - run the same queries with different values
- Checks & alerts - get emailed when bad data appears
- Audits - all queries are tracked
- Security - works with your authentication system
- Queries
- Many charts and diagrams
- Supports data forecasting
- Set a query permissions
- Allow upload large data files in XLS, CSV, TSV, and JSON.
ankane7- Lightdash
Lightdash is an open-source BI dashboard that provides a simple and intuitive interface for visualizing and analyzing data, helping businesses make data-driven decisions.
Hamza Mousa
8- Poli
Poli is a free and open-source easy-to-use BI server built for SQL lovers. Power data analysis in SQL and gain faster business insights. It comes with a built-in SQL editor, schema viewer, connects to any SQL database engines, interactive reports, and advanced user management.
shzlw9- Datart
Datart is a next generation Data Visualization Open Platform.
running-elephant10- Mprove
Mprove is an innovative self-service business intelligence platform that allows users to easily analyze and visualize data. With its powerful version control system, Mprove ensures that all changes to data models and visualizations are tracked and can be easily reverted if necessary.
This feature provides users with a level of flexibility that is not found in other BI tools. Additionally, Mprove's intuitive interface and user-friendly design make it an accessible platform for users of all levels of technical expertise. With Mprove, businesses can streamline their data analysis processes and gain valuable insights into their operations that can inform key strategic decisions.
mprove-io10- Turnilo
Turnilo is a powerful and user-friendly web application that has been specifically designed to provide state-of-the-art business intelligence, data exploration, and visualization capabilities for Apache Druid. Druid is a high-performance, column-oriented, distributed data store that is designed for OLAP queries on large datasets.
The application is a fork of Pivot, which has been widely recognized as one of the best data exploration and visualization tools available for Druid. Pivot is currently only available under a commercial license, which makes it inaccessible to many users. However, with Turnilo, users can now enjoy all the benefits of Pivot without having to pay a dime. This repository was created by forking the stalled Swiv repository, and it includes the latest version of Pivot under the Apache license.
In addition to its powerful features, Turnilo is also highly customizable, making it an ideal solution for businesses of all sizes and industries.
With its intuitive drag-and-drop interface, users can easily create and customize charts, graphs, and other visualizations to suit their specific needs. Turnilo also supports a wide range of data sources, including CSV, JSON, and SQL databases, making it easy to import data from a variety of sources.
With Turnilo, businesses can gain powerful insights into their data and make more informed decisions. Whether you are looking to explore new opportunities, identify trends, or optimize your operations, Turnilo has everything you need to take your business to the next level.
allegro11- OpenMining Business Intelligence (BI) Application Server
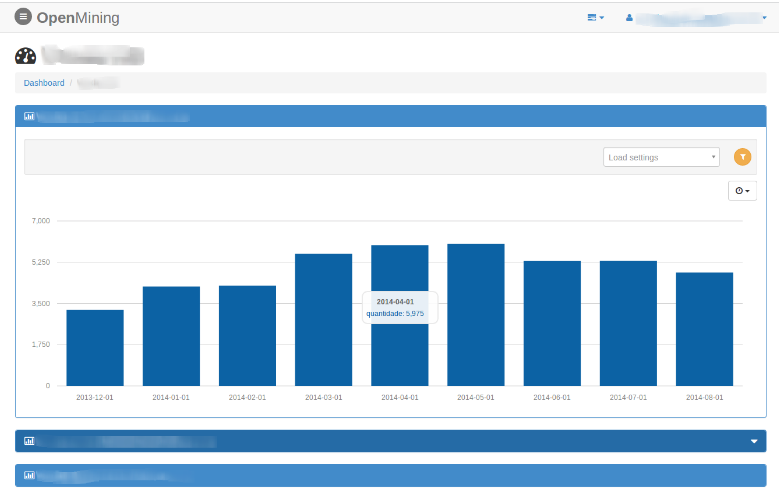
OpenMining is a free and open-source business intelligence (BI) Application Server written in Python.
mining12- G6VP BI low-code
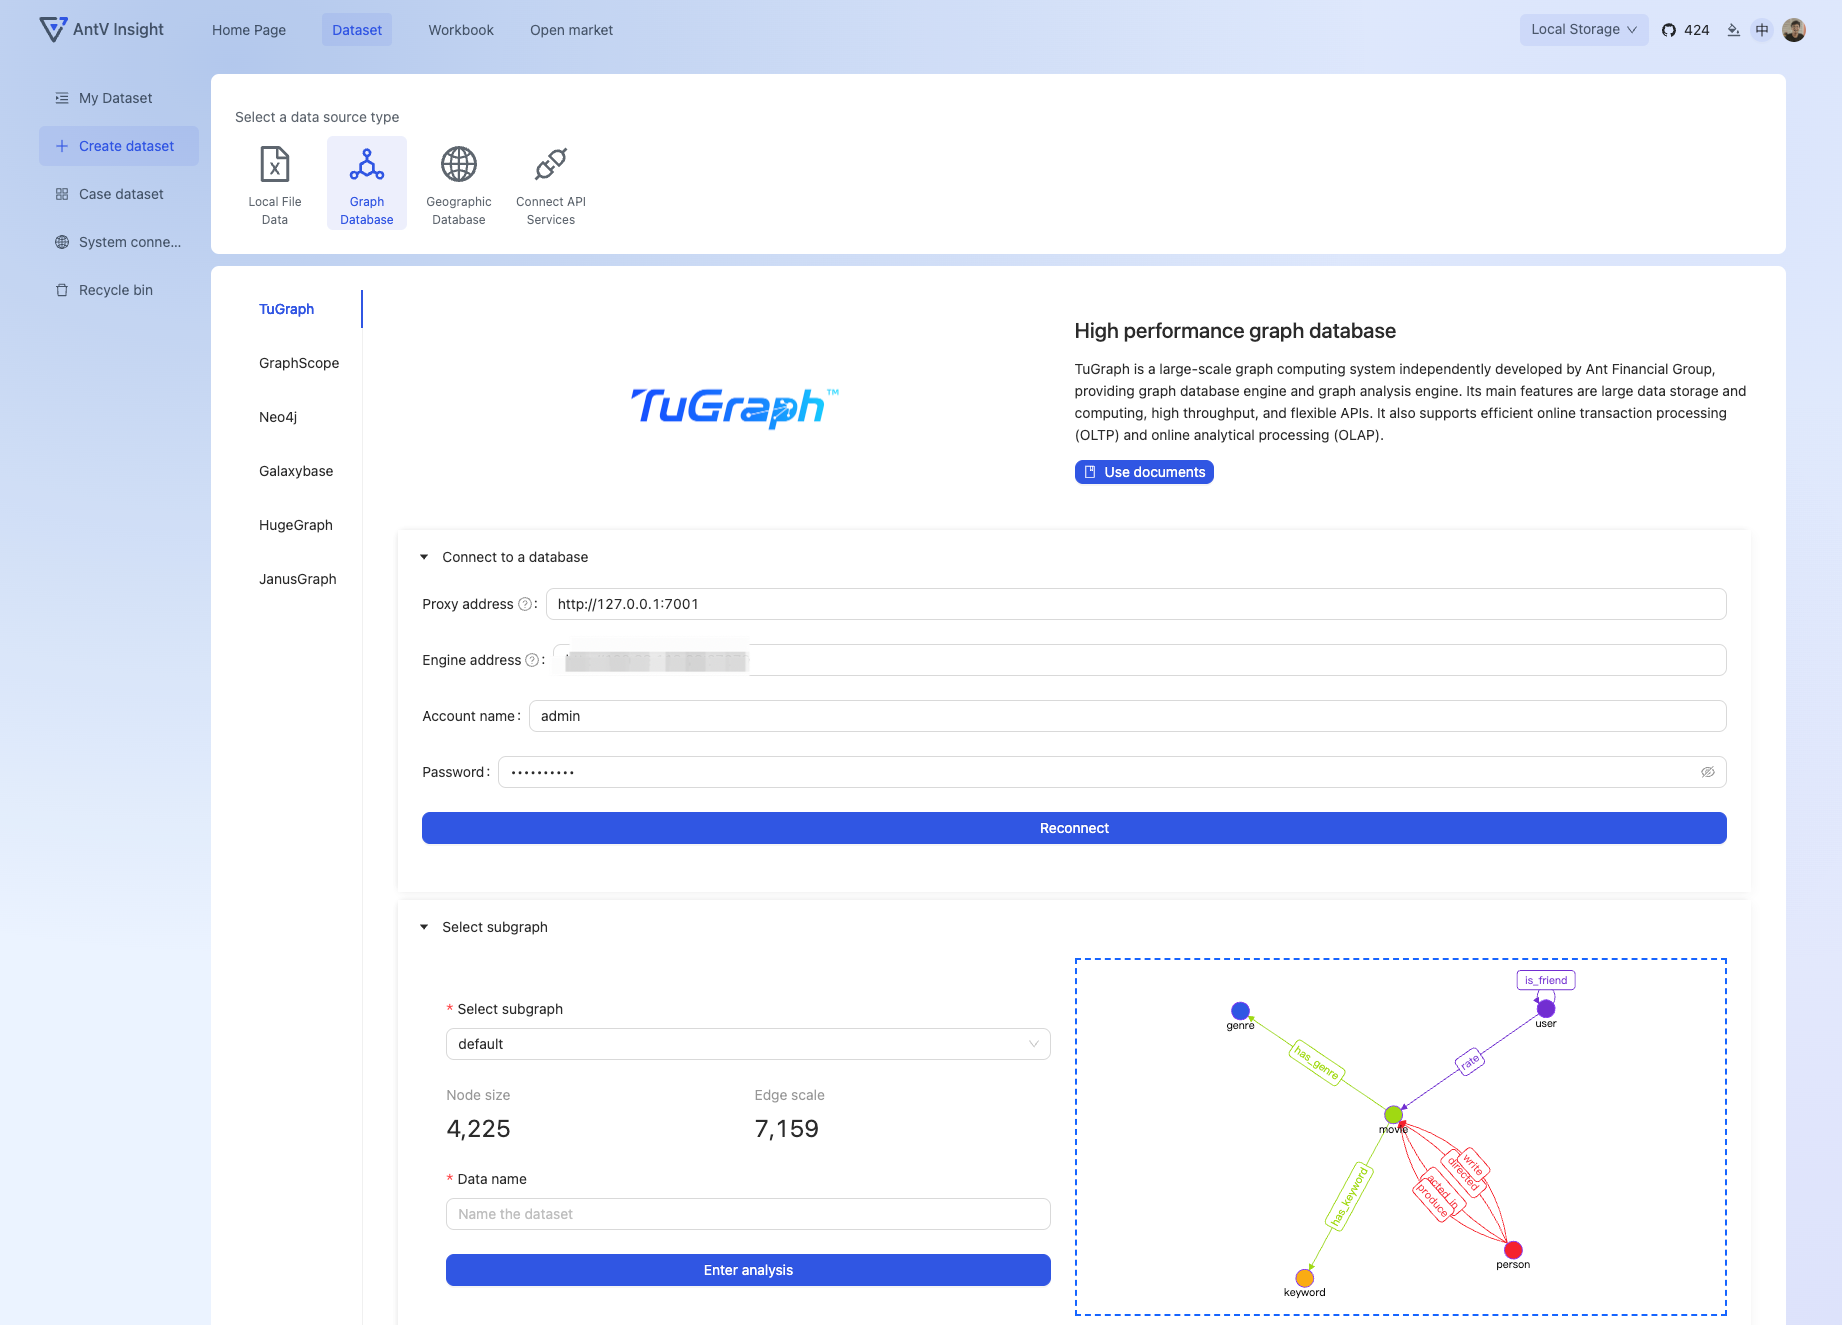
G6VP is a powerful online visual analysis tool that offers a wide range of features for graph analysis. The tool is designed to be user-friendly, making it easy for users to understand and utilize its functionalities.
With G6VP, you can easily analyze and visualize complex graphs, making it an ideal tool for researchers, academics, and analysts alike.
In addition to its visual analysis capabilities, G6VP is also a low-code platform for building graph applications. This means that users can easily create graph applications without having to write complex code. The platform is based on the AntV G6 Visualization Platform, which is known for its high-quality visualizations and interactive features.
G6VP was formerly known as AntV/GraphInsight, and has since undergone significant improvements. The platform now offers a range of new features, including improved visualization tools, enhanced data import and export capabilities, and improved collaboration tools. With these new features, users can now create more complex and sophisticated graph applications with ease.
Overall, G6VP is a powerful and versatile tool that offers a range of features for graph analysis and application development. Whether you are a researcher, academic, or analyst, G6VP has everything you need to analyze and visualize your data with ease and efficiency.
antvis13- KNOWAGE
KNOWAGE is an open-source analytics and business intelligence tool that combines traditional and big/cloud data sources for insights. It includes data federation, mash-up, data/text mining, and advanced visualization for multi-source analysis. The suite has two main modules and four plugins to meet all user needs.
KnowageLabs14- Tellery
Tellery is an open-source web-based system that lets you build metrics using SQL and bring them to your team. As easy as using a document. As powerful as a data modeling tool.
Tellery feature highlights:
- Let business users get answers in just a few clicks. No longer communicate in tables and columns.
- Build beautiful documents & dashboards visually with drag-and-drop ease
- An editor with rich text styling features, slash commands, and markdown support
- A modern SQL editor with multi-tabs and auto-complete
- Model your data with just SQL and reference like CTEs
- Review work and collaborate in real-time with multiplayer
- Import dbt models and sources and inspect their metadata while editing SQL.
tellery15- Helical Insight
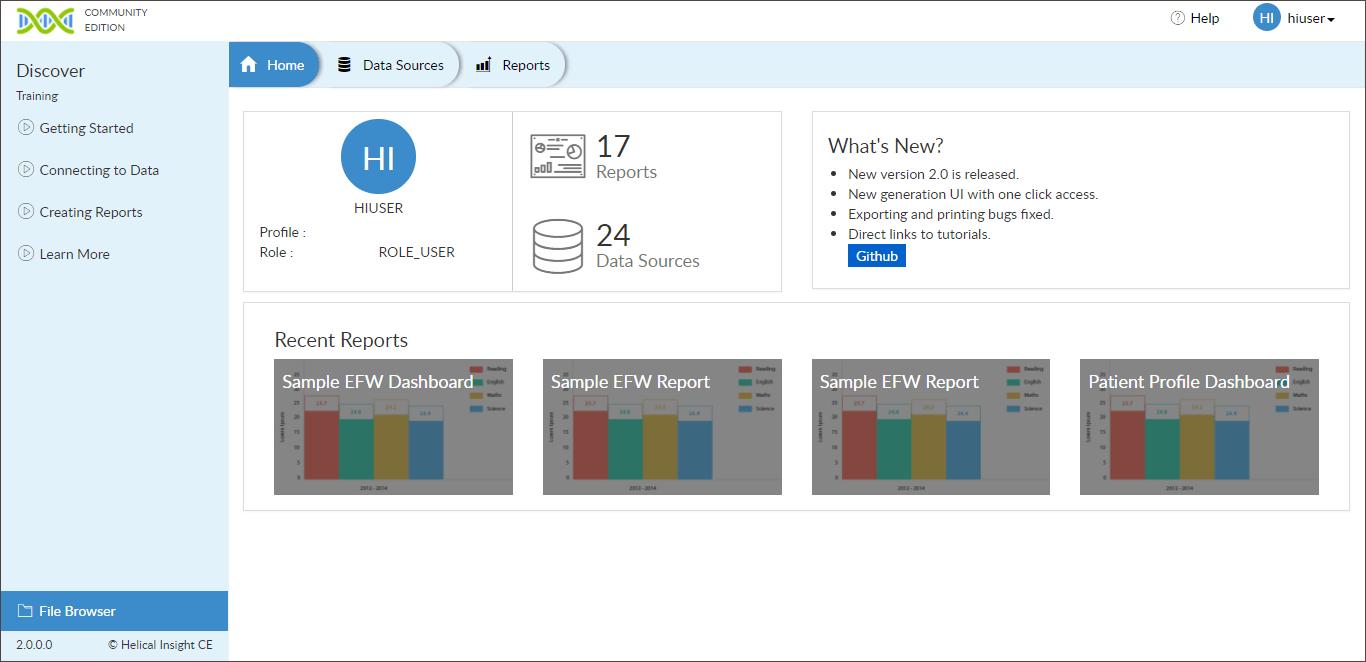
Helical Insight is an open-source Business Intelligence framework that helps you derive insights from one or multiple data sources. It offers all the features of a BI tool, whether open source or proprietary. As a framework, Helical Insight is highly extensible via APIs and SDKs, allowing you to extend its features without compromising on your business requirements. It also includes a unique Workflow rule engine that enables you to implement custom business processes.
Hamza Mousa helicalinsight
16- BoardTopic
BoardTopic utilizes cutting-edge technologies to provide efficient topic modeling and analysis. It makes use of state-of-the-art frameworks such as BERTopic, which allows for more accurate and comprehensive topic modeling.
Additionally, the platform makes use of fine-tuned large language models from Hugging Face to help users analyze and make sense of their data in a more intuitive and user-friendly manner. With BoardTopic, you can now harness the power of these advanced technologies without the need for coding knowledge or experience.
yarakyrychenko17- Amora Data Build Tool
Amora Data Build Tool is an indispensable tool for analysts and engineers who want to transform data on their data warehouse (BigQuery). With Amora, you can write Amora Models, which are descriptions of the data schema using Python's PEP484 - Type Hints and select statements combined with SQLAlchemy.
Not only that, but Amora can also convert Python code into SQL data transformation jobs that run inside the warehouse, making it an extremely powerful tool that can help you get more out of your data. So if you're looking for a reliable and efficient way to transform your data, then Amora is definitely worth checking out.
mundipagg18- Malloy Composer
Malloy Composer is a simple application to build dashboards or run ad-hoc queries using an existing Malloy model.
Malloy Composer can be run with a built in web server (Full Mode) and can access BigQuery, Postgres and DuckDB or in WASM Mode, running entirely in a web browser. In WASM Mode, Malloy Composer can only access csv and parquet files (via DuckDB).
malloydata19- Mojito
Mojito is an open-source data visualization and interactive dashboards platform. Layers can draggable resizable scalable rotatable groupable locked. Use react, vue2, vue3 custom components. Event handler, Dynamic script, and many more.
It is written in Node.js, and can be easily installed on the local machine or any remote server.
drinkjs20- Urungi

Urungi is a powerful tool for creating and managing statistics and dashboards from a variety of SQL data sources, including PostgreSQL, MySQL, MS SQL Server, and Oracle. With Urungi, you can easily centralize your data and gain valuable insights through custom views and reports.
Hamza Mousa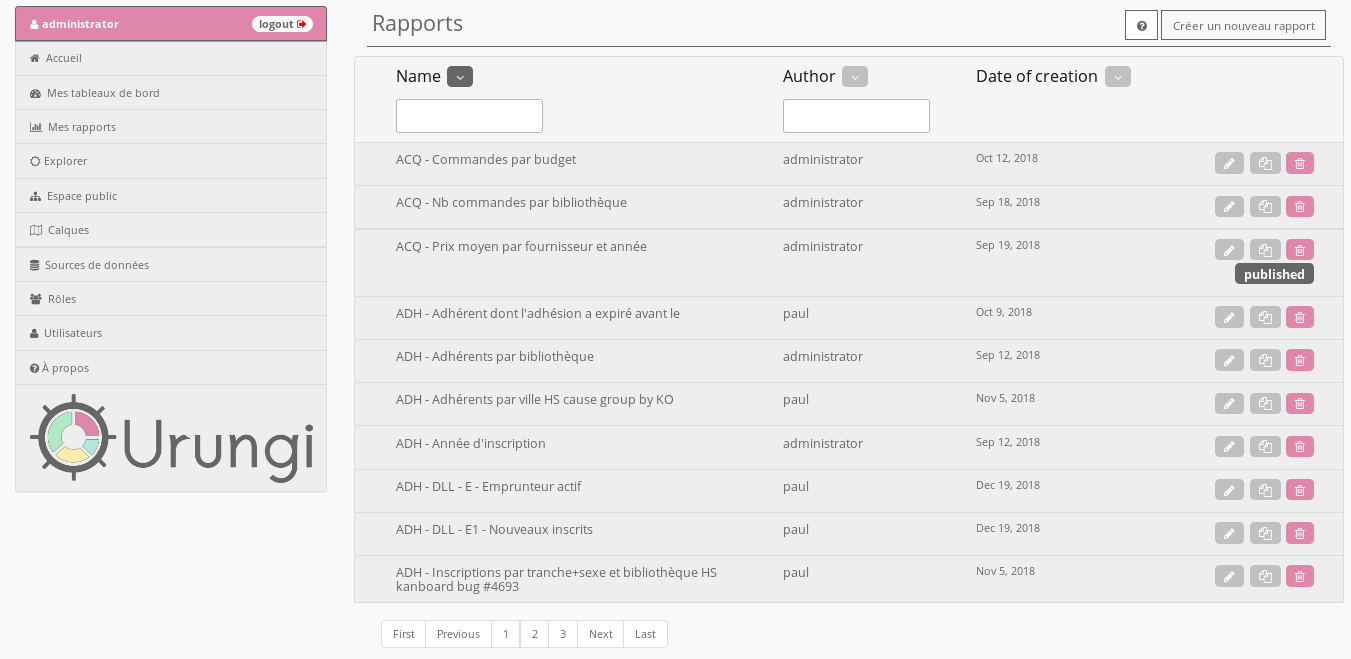
21- Grafana
Grafana simplifies the process of querying, visualizing, and alerting on metrics with features like fast and flexible visualizations, dynamic and reusable dashboards, ad-hoc queries, alerting, and mixed data sources.
grafana22- Panel
Hamza Mousa
Final note
Business Intelligence (BI) is the process of collecting, analyzing, and presenting data to make informed business decisions. BI Dashboards are an essential part of BI tools that provide a visual representation of complex data, offering real-time insights into organizational performance.
Open-source BI dashboards are becoming increasingly popular due to their cost-effectiveness and flexibility. Some popular open-source BI dashboards include Apache Superset, Metabase, and Redash. Other BI tools include G6VP, KNOWAGE, Helical Insight, BoardTopic, Amora Data Build Tool, and Urungi.