Top 25 Python Libraries and Frameworks for Stunning Data Visualizations in 2024


Table of Content
For Python developers, mastering these visualization tools can significantly enhance their skill set, making them more valuable in the job market and enabling them to tackle a broader range of data-driven projects.
Benefits of Data Visualization for Python Projects, Data Science, and Analytics:
- Enhanced Data Understanding: Visualizations simplify complex data, making it easier to identify patterns, trends, and outliers. This leads to better insights and more informed decision-making.
- Improved Communication: Visual data is more engaging and easier to interpret, helping teams and stakeholders understand findings quickly and accurately.
- Efficient Analysis: Tools like Vizro streamline the creation of dashboards, allowing data scientists and analysts to focus on extracting insights rather than coding.
- Scalability and Flexibility: Python’s visualization libraries support a wide range of data types and sources, making them suitable for projects of any size and complexity.
- Community and Support: The extensive Python community provides a wealth of resources, tutorials, and support, ensuring continuous improvement and innovation in data visualization techniques.
Medevel.com offers a wealth of Python-related content, including articles and curated collections. These resources cover a wide range of topics, making them valuable for various tech professionals, including:
- Software developers
- Data scientists
- Data engineers
- Web developers
Discover our comprehensive Python resources by exploring the list below:
- Python Scraping Libraries
- Python Packages for Data scientists
- Top Libraries to Build Desktop Apps using Python
- Python UI Libraries for Building Desktop Apps
- 23 Frameworks to Build Data-focused Apps using Python
- Free and Open-source Python IDE to boost your development
- Revolutionizing Healthcare: The Impact of Python in Bioinformatics, Medicine, and AI Integration
Python Data Visualization Libraries and Projects
In the following list, we collected the best open-source free data visualization libraries for Python.
1. Matplotlib
Matplotlib is a versatile Python library for creating high-quality static, animated, and interactive visualizations. It simplifies complex plotting tasks and allows for extensive customization.
You can create publication-ready plots, interactive figures with zoom and pan features, customize styles and layouts, export to various formats, and integrate with JupyterLab and GUIs. Additionally, it supports a wide range of third-party packages.
2. Seaborn
Built on top or Matplotlib, It provides a high-level interface for drawing attractive statistical graphics.
3. Plotnine
Plotnine is a Python library that implements a grammar of graphics, similar to ggplot2 in R.
It allows you to create plots by mapping dataframe variables to visual characteristics like position, color, and size. This approach makes it easy to build both simple and complex plots incrementally.
4. Bokeh
Bokeh is a Python library designed for interactive data visualization in modern web browsers. It allows users to create versatile graphics with high-performance interactivity, making it ideal for large or streaming datasets.
Bokeh is particularly useful for building interactive plots, dashboards, and data applications efficiently.
5. Vega-Altair
Vega-Altair is a declarative visualization library for Python. It is simple, friendly and consistent API, built on top of the powerful Vega-Lite grammar, empowers you to spend less time writing code and more time exploring your data.
6. Plotly
Plotly is a free and open-source interactive graphing library for Python.
7. Taipy
Taipy is an open-source self-hosted project that enables Python developers and data scientists to turns Data and AI algorithms into production-ready web applications in no time.
It is ideal choice for creating data dashboards, and complex AI data apps.
8- Charts
Chart is a free and open-source simple library for Jupyter to create interactive charts.
It is easy to use but comes with limited number charts as bar graphs, scatter plots, histogram, line charts and no more.
9- Sweetviz
Sweetviz is an open-source Python library that generates beautiful, high-density visualizations to kickstart EDA (Exploratory Data Analysis) with just two lines of code. Output is a fully self-contained HTML application.
The system is built around quickly visualizing target values and comparing datasets. Its goal is to help quick analysis of target characteristics, training vs testing data, and other such data characterization tasks.
10. Streamlit
Streamlit is an open-source Python platform that simplifies the creation and sharing of web applications for machine learning and data science.
It allows users to transform data scripts into interactive web apps quickly, without needing extensive web development skills. Streamlit supports building various applications, including LLMs apps, chatbots, science apps, and data visualization apps.
Its ease of use and powerful features, such as ready-to-use data widgets and multi-page app support, make it a popular choice for rapid prototyping and deployment among data scientists and developers.
11. Mercury
Mercury is a free, open-source application that enables you to integrate interactive widgets into Python notebooks, allowing you to share them as web applications. It provides a variety of widgets with straightforward cell re-execution capabilities.
12. svg.charts
svg.charts is a pure-python library for generating charts and graphs using Scalable Vector Graphics.
13. Lightweight Charts Python
Python framework for TradingView's Lightweight Charts JavaScript library.
14- chartpy
Chartpy provides an easy-to-use API for plotting with various Python chart libraries like Plotly (via Cufflinks), Bokeh, and Matplotlib, all through a unified interface.
You can switch between chart engines by changing a single keyword, avoiding the need to learn each library’s details. Additionally, it includes new stylesheets and formatting to give Matplotlib a more modern look using the Open Sans font.
15- Vizro
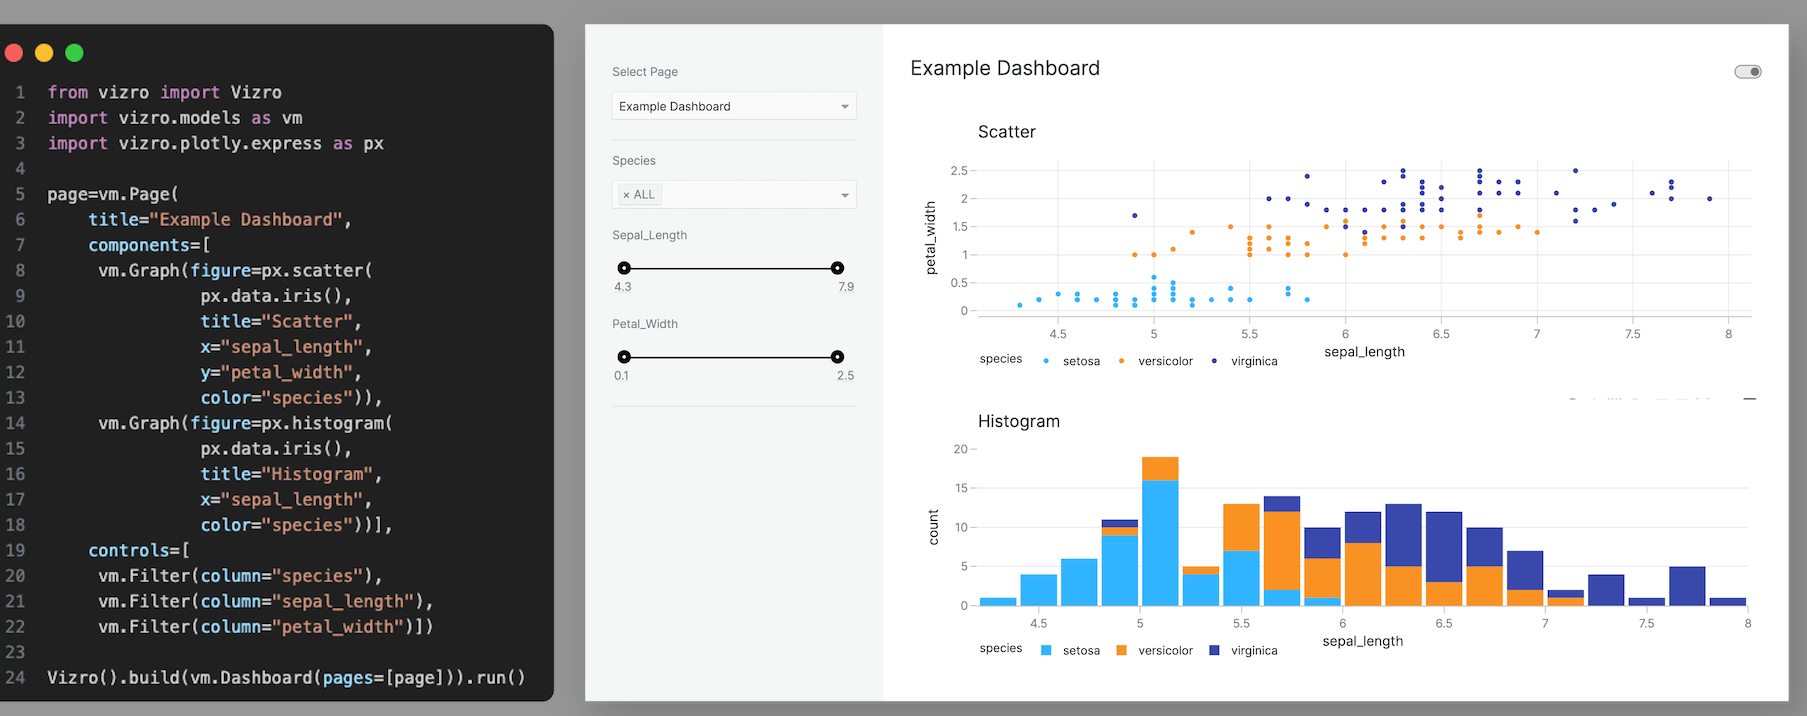
Vizro is a tool for creating customized, Python-enabled data visualization dashboards quickly and easily, without needing advanced coding or design skills.
It uses simple configuration to build complex dashboards with libraries like Plotly and Dash, incorporating best practices in coding and design.
Key features include:
- Components: Create charts, tables, and input/output interfaces.
- Controls: Add filters, parameter inputs, and custom action controllers.
- Pages and Layouts: Design multiple pages with customizable layouts and flexible navigation.
- Actions and Interactions: Enable interactions between charts and use predefined or custom actions, such as exporting data.
Configurations can be written in various formats (Pydantic models, JSON, YAML, Python dictionaries) for flexibility. High-code extensions allow for extensive customization, blending low-code and high-code approaches for scalable applications.
16. Python Graphs
This is a free and open-source (Apache-2.0 Licensed) static analysis library for computing graph representations of Python programs suitable for use with graph neural networks.
17- Classic Stock Charts in Python
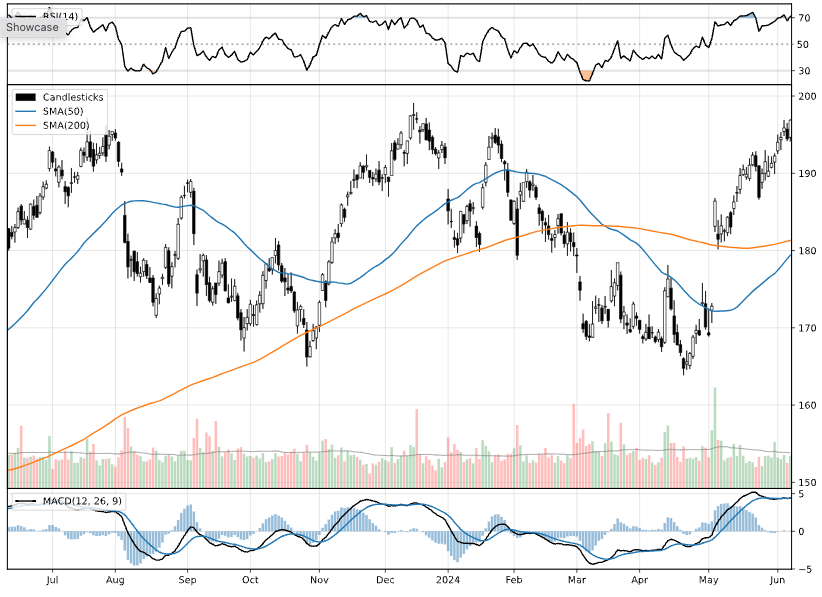
Create classic technical analysis stock charts in Python with minimal code. The library is built around matplotlib and pandas.
Charts can be defined using a declarative interface, based on a set of drawing primitives like Candleststicks, Volume and technical indicators like SMA, EMA, RSI, ROC, MACD, etc ...
18. ipyvizzu
ipyvizzu is an animated charting tool designed for platforms like Jupyter, Google Colab, Databricks, Kaggle, and Deepnote notebooks.
It allows data scientists and analysts to use animation for data storytelling with Python. Built on the open-source JavaScript/ C++ charting library Vizzu, ipyvizzu enhances data visualization by making it more dynamic and engaging.
ippyvizzue current features are:
- Designed with animation in focus;
- Defaults based on data visualization guidelines;
- Works with
Pandasdataframe, while alsoJSONand inline data input is available; - Auto scrolling feature to keep the actual chart in position while executing multiple cells.
 vizzuhq
19. ipychart
This library enables Python developers and data scientists to use Chart.js with Python.
20- Leather
Leather is the Python charting library for those who need charts now and don't care if they're perfect.
21- Aim
AIM is an open-source, self-hosted, web-based experiment tracker and visualization platform for Python. It logs training runs and AI metadata, providing a user-friendly interface to compare and observe them.
AIM also offers an API for programmatic queries, making it a powerful tool for tracking and visualizing AI experiments.
22- Datapane
Datapane makes it simple to build interactive reports in seconds using Python.
Import Datapane's Python library into your script or notebook and build reports programmatically by wrapping components such as:
- Pandas DataFrames
- Plots from Python visualization libraries such as Bokeh, Altair, Plotly, and Folium
- Markdown and text
- Files, such as images, PDFs, JSON data, etc.
- Interactive forms which run backend Python functions
Datapane reports are interactive and can also contain pages, tabs, drop downs, and more. Once created, reports can be exported as HTML, shared as standalone files, or embedded into your own application, where your viewers can interact with your data and visualizations.
23. Crayon
Crayon is a framework that gives you access to the visualisation power of TensorBoard with any language. Currently it provides a Python and a Lua interface, however you can easily implement a wrapper around the provided RESTful API.
24- pyCirclize

pyCirclize is a circular visualization python package implemented based on matplotlib.
This package is developed for the purpose of easily and beautifully plotting circular figure such as Circos Plot and Chord Diagram in Python.
In addition, useful genome and phylogenetic tree visualization methods for the bioinformatics field are also implemented. pyCirclize was inspired by circlize and pyCircos.
25- Lonboard
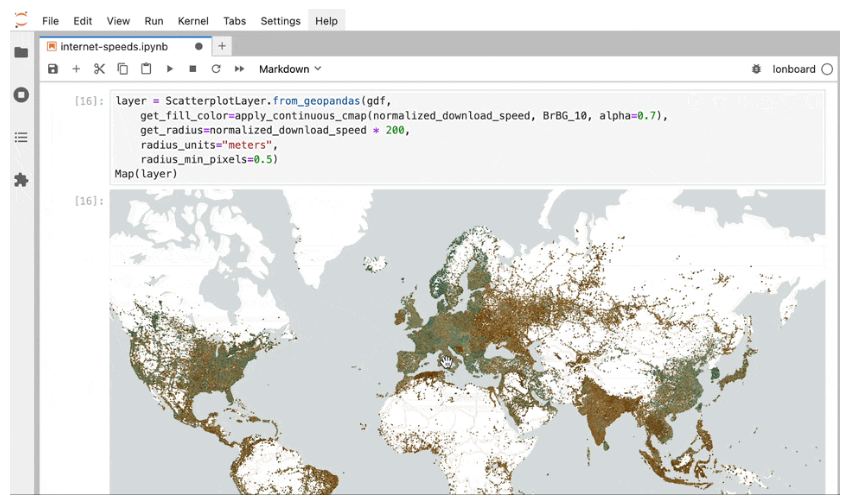
A Python library for fast, interactive geospatial vector data visualization in Jupyter.
Building on cutting-edge technologies like GeoArrow and GeoParquet in conjunction with GPU-based map rendering, Lonboard aims to enable visualizing large geo-spatial datasets interactively through a simple interface.