8 Free SPSS Alternatives and Free Statistical Programs for Windows

Are You Truly Ready to Put Your Mobile or Web App to the Test?
Don`t just assume your app works—ensure it`s flawless, secure, and user-friendly with expert testing. 🚀
Why Third-Party Testing is Essential for Your Application and Website?We are ready to test, evaluate and report your app, ERP system, or customer/ patients workflow
With a detailed report about all findings
Contact us nowTable of Content
SPSS (Statistical Package for the Social Sciences) is a powerful software widely used for statistical analysis in social science research, healthcare, marketing, and various academic fields.
It provides tools for performing complex data analysis such as descriptive statistics, ANOVA, regression, factor analysis, and more.
SPSS offers an intuitive interface for users, making it accessible to non-programmers, while still supporting syntax-based commands for advanced users.
The software is known for its reliability and comprehensive features, which make it a go-to choice for professionals requiring detailed statistical evaluations.
Why You Need a Free, Open-Source Alternative to SPSS?
While SPSS is robust and user-friendly, its significant cost can be a barrier for many, especially students, researchers, and small organizations.
Licensing fees can be prohibitively expensive for prolonged use, and certain advanced features are locked behind additional paid modules.
Free, open-source alternatives provide a cost-effective solution while offering many of the same functionalities needed for data analysis.
Moreover, open-source programs foster community collaboration, enabling users to contribute to software improvement and customize it for specific needs.
In the following, you can find a list of the best open-source free SPSS alternatives that runs on Windows.
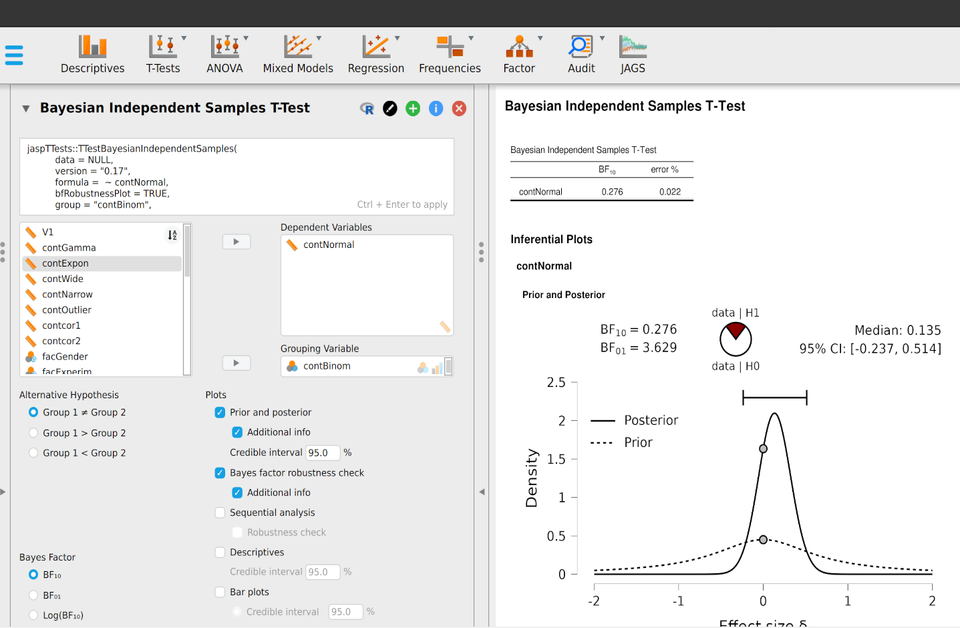
1- JASP
JASP is a lightweight, fully featured open-source statistical package that serves as an alternative to SPSS.
Features
- User-Friendly Interface: Intuitive navigation for easy accessibility.
- Statistical Analysis: Comprehensive range of analyses, including t-tests, ANOVA, and Bayesian statistics.
- Real-Time Results: Immediate feedback as parameters are adjusted, enhancing exploratory analysis.
- Open-Source: Free to use and modifiable, promoting transparency in research.
- Bayesian Methods: Robust Bayesian hypothesis testing alongside traditional methods.
- Flexible Output: Export results in PDF, HTML, or LaTeX formats for easy sharing.
- Integrated R: Run R scripts within JASP for advanced analysis options.
- Data Import: Supports CSV, Excel, and SPSS files for seamless data integration.
- Multilingual Support: Available in various languages to cater to a global audience.
- Regular Updates: Continuously improved with new features based on user feedback.
2- RKWard
RKWard was originally designed for the Linux KDE desktop as an alternative to RStudio, but the development teams later built it to be installable on Windows and macOS.
Features
- Integrated R Environment: RKWard provides a seamless interface for R, making it easier to write scripts and run R commands.
- User-Friendly GUI: Offers a graphical user interface that simplifies statistical analysis, making it accessible for non-programmers.
- Dynamic Data Management: Features tools for importing, exporting, and managing data from various formats, including CSV and Excel.
- Extensive Statistical Functions: Supports a wide array of statistical tests and models, including regression analysis, ANOVA, and time series analysis.
- Customizable Output: Allows users to create and customize output formats for reports and presentations, facilitating easy sharing of results.
- Extensive Plotting Capabilities: Includes advanced plotting options for visualizing data and results, enhancing data interpretation.
- Plugin Support: Users can extend functionality through plugins, allowing for specialized analyses and features.
- Integrated Help System: Provides comprehensive documentation and help resources within the application for user support.
- Cross-Platform Compatibility: Runs on various operating systems, including Windows, macOS, and Linux, ensuring broad accessibility.
- Open Source: As a free tool, RKWard allows for community contributions and transparency in its development.
- Spreadsheet-like data editor
- Syntax highlighting, code folding and code completion
- Data import (e.g. SPSS, Stata and CSV)
- Plot preview and browsable history
3- Jamovi
Jamovi is an excellent free alternative to SPSS for Windows, Linux, and macOS. Despite its lightweight nature, it offers a variety of useful features, including the ability to open and manage large data files, export to various formats, and more.
Features
- Data Import: Easily import data from various formats, including SPSS, Excel, and CSV.
- Dynamic Output: Automatically updates analysis outputs when data is modified.
- Interactive User Interface: User-friendly design with drag-and-drop functionality for easy data manipulation.
- Extensible: Support for R syntax and custom modules to extend functionalities.
- Analysis Variety: Comprehensive statistical analysis options, including t-tests, ANOVA, regression, and non-parametric tests.
- Results Export: Export results in various formats such as PDF, HTML, and Word.
- Reproducible Research: Built-in tools for ensuring reproducibility of analyses.
- Real-Time Collaboration: Share and collaborate on analyses seamlessly.
- Graphical Output: Create visually appealing graphs and plots easily.
- Open Source: Completely free and open-source software, fostering community contributions.
4- SOFA Statistics
SOFA Statistics is a small statistical software that anyone can use for free, especially students for their statistical homework. It is available at no cost and works on Windows, Linux, and macOS
Features
- User-Friendly Interface: Enjoy a straightforward, intuitive interface designed for users at all skill levels, making data analysis accessible and efficient.
- Comprehensive Statistical Tools: Access a wide range of statistical methods, including descriptive statistics, t-tests, ANOVA, regression analysis, and non-parametric tests to meet diverse analytical needs.
- Visual Data Representation: Create stunning and informative graphs and charts effortlessly, helping you present data in a visually appealing manner.
- Customizable Reports: Generate detailed reports that can be easily customized to suit your specific needs, providing clear insights from your data analysis.
- Data Import Flexibility: Import data from various sources, including Excel and CSV files, ensuring seamless integration with your existing datasets.
- Cross-Platform Compatibility: Available for Windows, Linux, and macOS, SOFA Statistics offers versatility for users on different operating systems.
- Real-Time Analysis: Perform real-time statistical analyses as you manipulate data, enhancing your productivity and decision-making speed.
- Extensive Documentation and Support: Benefit from comprehensive user manuals and support resources, ensuring you can maximize the use of the software.
- Open-Source Solution: Enjoy the benefits of open-source software, including community-driven improvements and free access to all features without hidden costs.
- Data Management Features: Effectively manage and organize your datasets, facilitating easier access and manipulation during your analyses.
5- GNU PSPP
GNU PSPP is a free program for statistical analysis of data. It serves as a free alternative to the proprietary SPSS software and closely resembles it, but with some key differences.
PSPP is a stable and reliable tool that can perform various analyses, including descriptive statistics, T-tests, ANOVA, linear and logistic regression, and more. Its backend is optimized for fast performance, no matter how large your data set is. You can use PSPP either through a graphical interface or by entering commands directly.
Features
- Support for Large Datasets: Handles over 1 billion cases and variables.
- SPSS Compatibility: Compatible with SPSS syntax and data files.
- User Interface Options: Offers both terminal and graphical user interfaces.
- Output Formats: Supports output in text, PostScript, PDF, OpenDocument, or HTML formats.
- Interoperability: Works with Gnumeric, LibreOffice, OpenOffice.org, and other free software.
- Data Import: Easily imports data from spreadsheets, text files, and databases.
- Concurrent Analysis: Ability to open, analyze, and edit multiple datasets at the same time, with options to merge, join, or concatenate them.
- Multilingual Support: User interface supports various character sets and multiple languages.
- Fast Performance: Optimized for quick statistical procedures, even with large datasets.
- No Licensing Fees: Completely free to use with no license fees or expiration.
- Ethical Use: No unethical end-user license agreements.
- Comprehensive Documentation: Includes a fully indexed user manual.
- GPLv3 License: Freedom of use is ensured as it is licensed under the GPLv3 or later.
- Portability: Runs on various operating systems, with a preference for GNU/Linux.
6- BIOSTATS
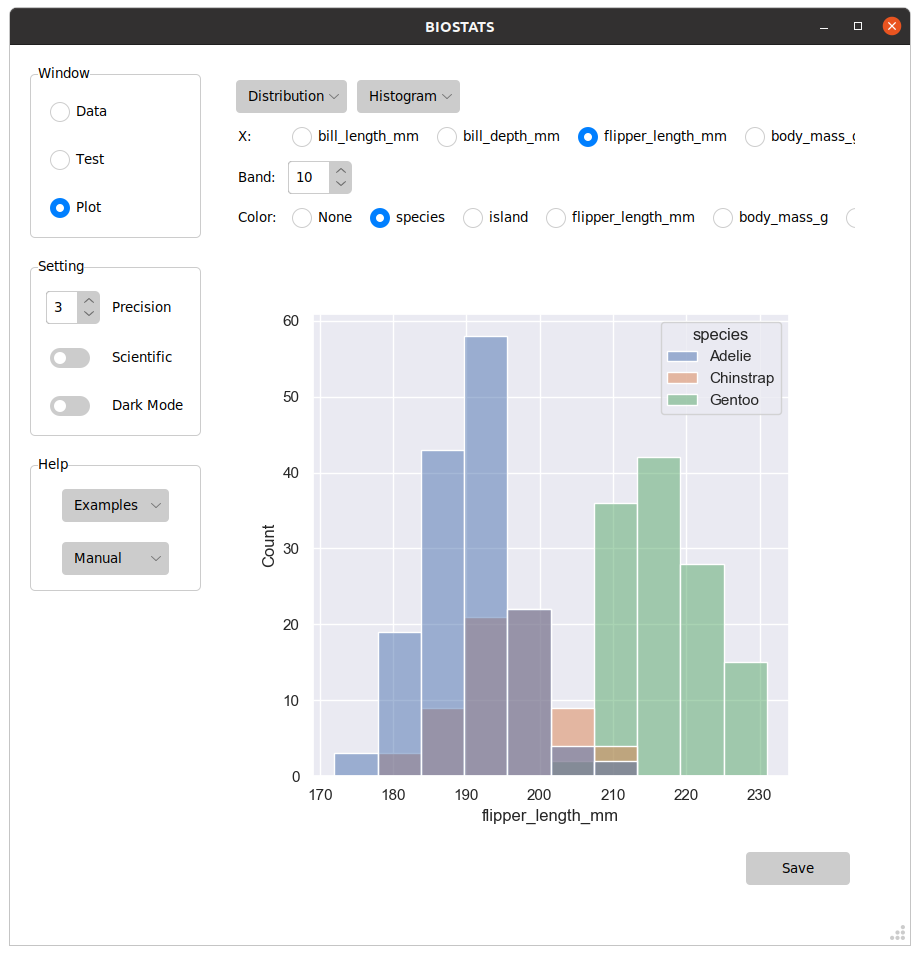
BIOSTATS is a simple statistical analysis package designed for biological and ecological data. Developed in Python, it provides various tools for data manipulation, analysis, and visualization, making it an invaluable resource for researchers and practitioners in biology, ecology, and related fields.
The app emphasizes usability and includes functions for statistical tests, data visualization, and model fitting, facilitating a comprehensive approach to data analysis in the life sciences.
BIOSTATS is particularly useful for anyone involved in biological research who requires a robust statistical analysis tool that is accessible and effective.
Features
- Statistical Analysis Tools: Provides functions for a variety of statistical tests (e.g., t-tests, ANOVA).
- Data Visualization: Includes built-in tools for visualizing data with plots and graphs.
- User-Friendly: Designed with usability in mind for both novice and experienced users.
- Integration with Python: Built on Python, allowing for seamless integration with other scientific libraries.
- Comprehensive Documentation: Offers extensive documentation and examples to aid users in understanding and utilizing the package effectively.
- Support for Biological Data: Tailored for analyzing biological and ecological datasets, making it highly relevant for life sciences research.
- Model Fitting: Capable of fitting statistical models to data, which is essential for hypothesis testing and prediction.
7- RStudio
R is an open-source statistical programming language designed for the scientific community. While it operates from the command line, RStudio is a desktop application that makes it easier to work with the R language and its packages.
RStudio is an ideal for any R developers on any platform as it works on Windows 10/11, Ubuntu, openSUSE, Fedora, and macOS.
Its features include:
- Syntax Highlighting: Enhances code readability by coloring different elements of the syntax.
- Code Completion: Suggests and completes code as you type, improving efficiency.
- Smart Indentation: Automatically formats code indentation for better structure.
- Direct Code Execution: Run R code directly from the source editor without additional steps.
- Function Definition Navigation: Quickly jump to the definitions of functions for easier reference.
- Real-Time Changes: View content updates in real-time using the Visual Markdown Editor.
- Working Directory Management: Easily switch between multiple working directories to organize projects.
- Integrated Help: Access R help and documentation directly within the application.
- Interactive Debugger: Debug R scripts interactively to identify and fix issues.
- Package Development Tools: Comprehensive tools for developing and managing R packages.
8- Gretl
Gretl is a free, open-source software designed for econometric analysis, available under the GNU General Public License (GPL). It can be redistributed and modified freely.
Features
- User-Friendly Interface: Offers an intuitive interface available in multiple languages, including French, Spanish, German, and more.
- Wide Range of Estimators: Supports various estimators like least squares, maximum likelihood, and GMM, along with single-equation and system methods.
- Time Series Methods: Provides advanced time series analysis with ARIMA, GARCH-type models, VARs, and unit-root tests.
- Limited Dependent Variable Models: Includes models such as logit, probit, tobit, and various others for analyzing count and duration data.
- Panel Data Estimators: Supports instrumental variables, probit models, and dynamic panel models based on GMM.
- LaTeX Output: Can export results as LaTeX files in both tabular and equation formats for easy integration into documents.
- Integrated Scripting Language (Hansl): Features a powerful scripting language with extensive programming and matrix operation capabilities.
- Graphing Tools: Includes a GUI controller for fine-tuning Gnuplot graphs.
- Data Exchange Facilities: Enables easy data sharing and results exchange with other software such as R, Python, and Stata.
- Parallelization via MPI: Supports parallel computing to enhance performance.
- Mixed Time-Series Frequencies: Offers support for MIDAS (Mixed Data Sampling) methods.
- Machine Learning Support: Incorporates LIBSVM for machine learning applications.
- Extensive Data Format Support: Can handle various data formats, including XML, CSV, Excel, SPSS, and more, allowing for flexible data import/export.
- Add-ons and Function Packages: Provides additional functionality through various add-ons and contributed packages.