22 System Monitor Apps and Device Information Scanners for Linux Systems


Table of Content
System monitors are essential tools for tracking system performance and resource usage in real time.
They provide insights into CPU, memory, disk, and network activity, helping users manage both personal and server environments effectively. This is crucial for optimizing performance, troubleshooting issues, and ensuring the smooth operation of applications.
Many of these monitoring applications are also compatible with macOS, expanding their utility across different systems.
 Hazem Abbas
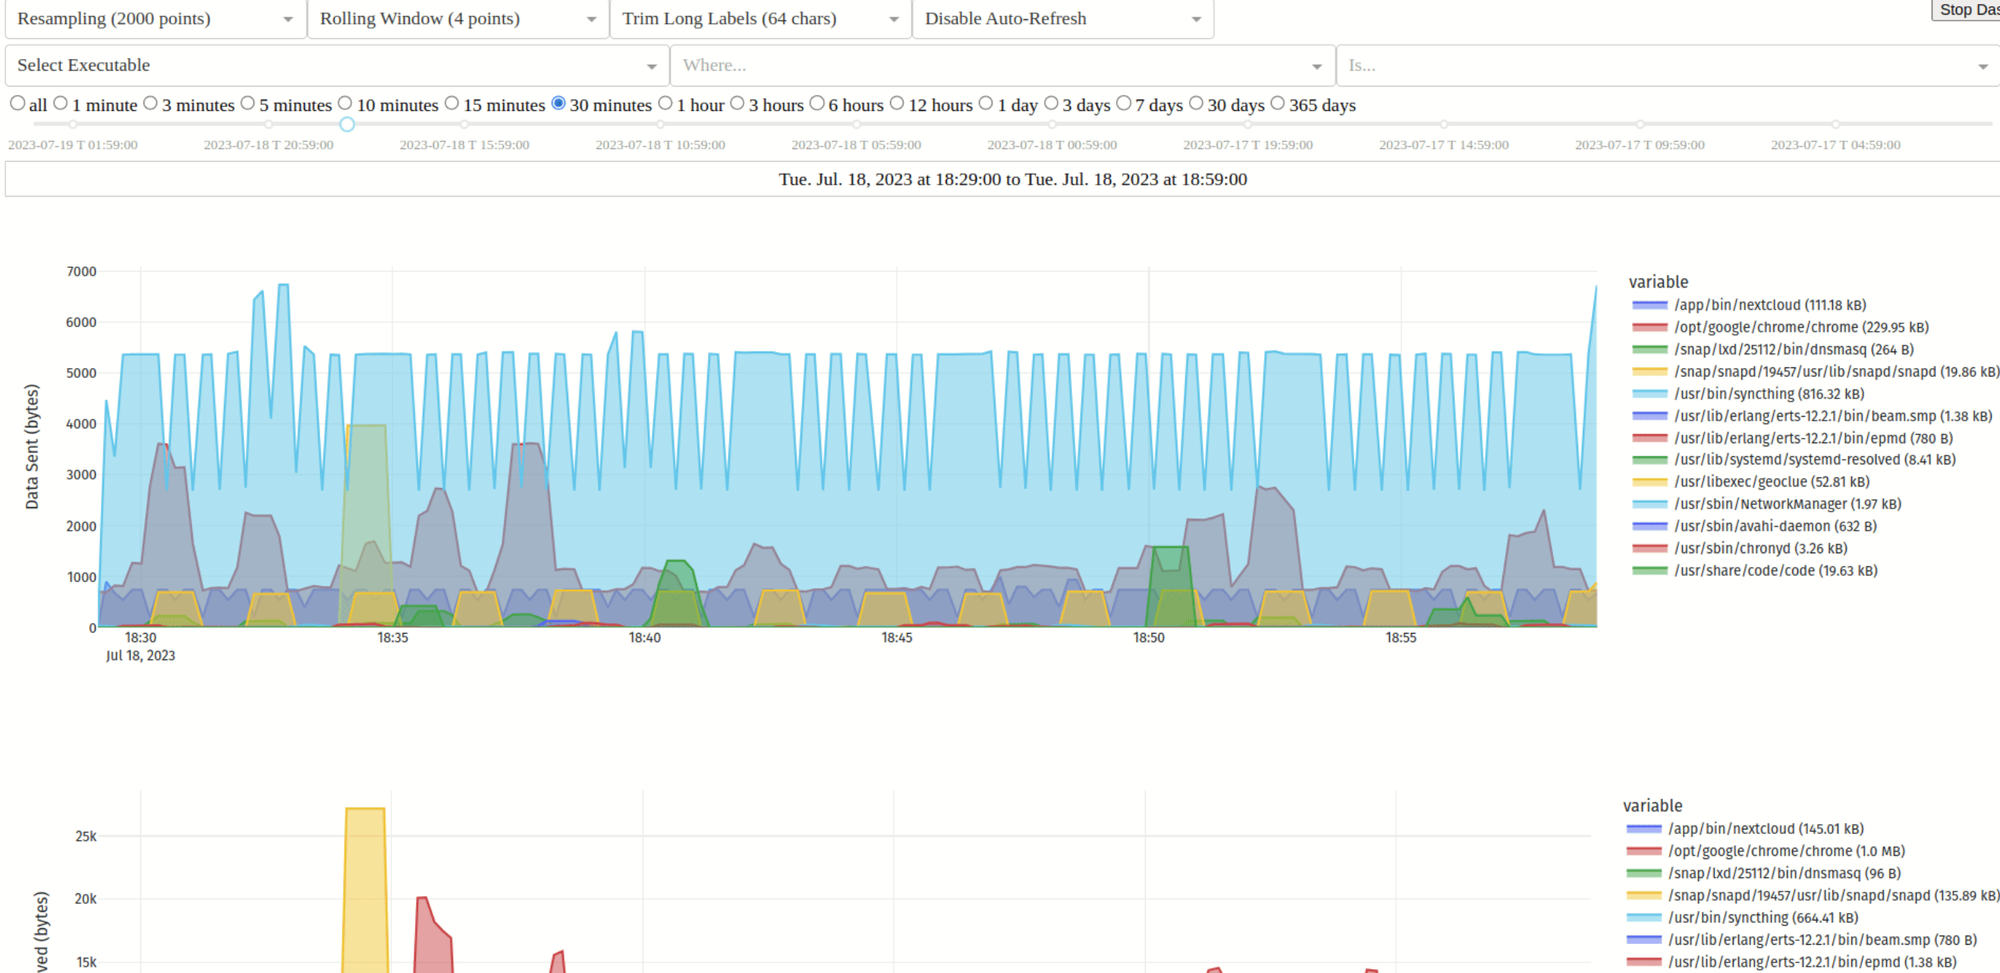 Hazem Abbas
 Hazem Abbas
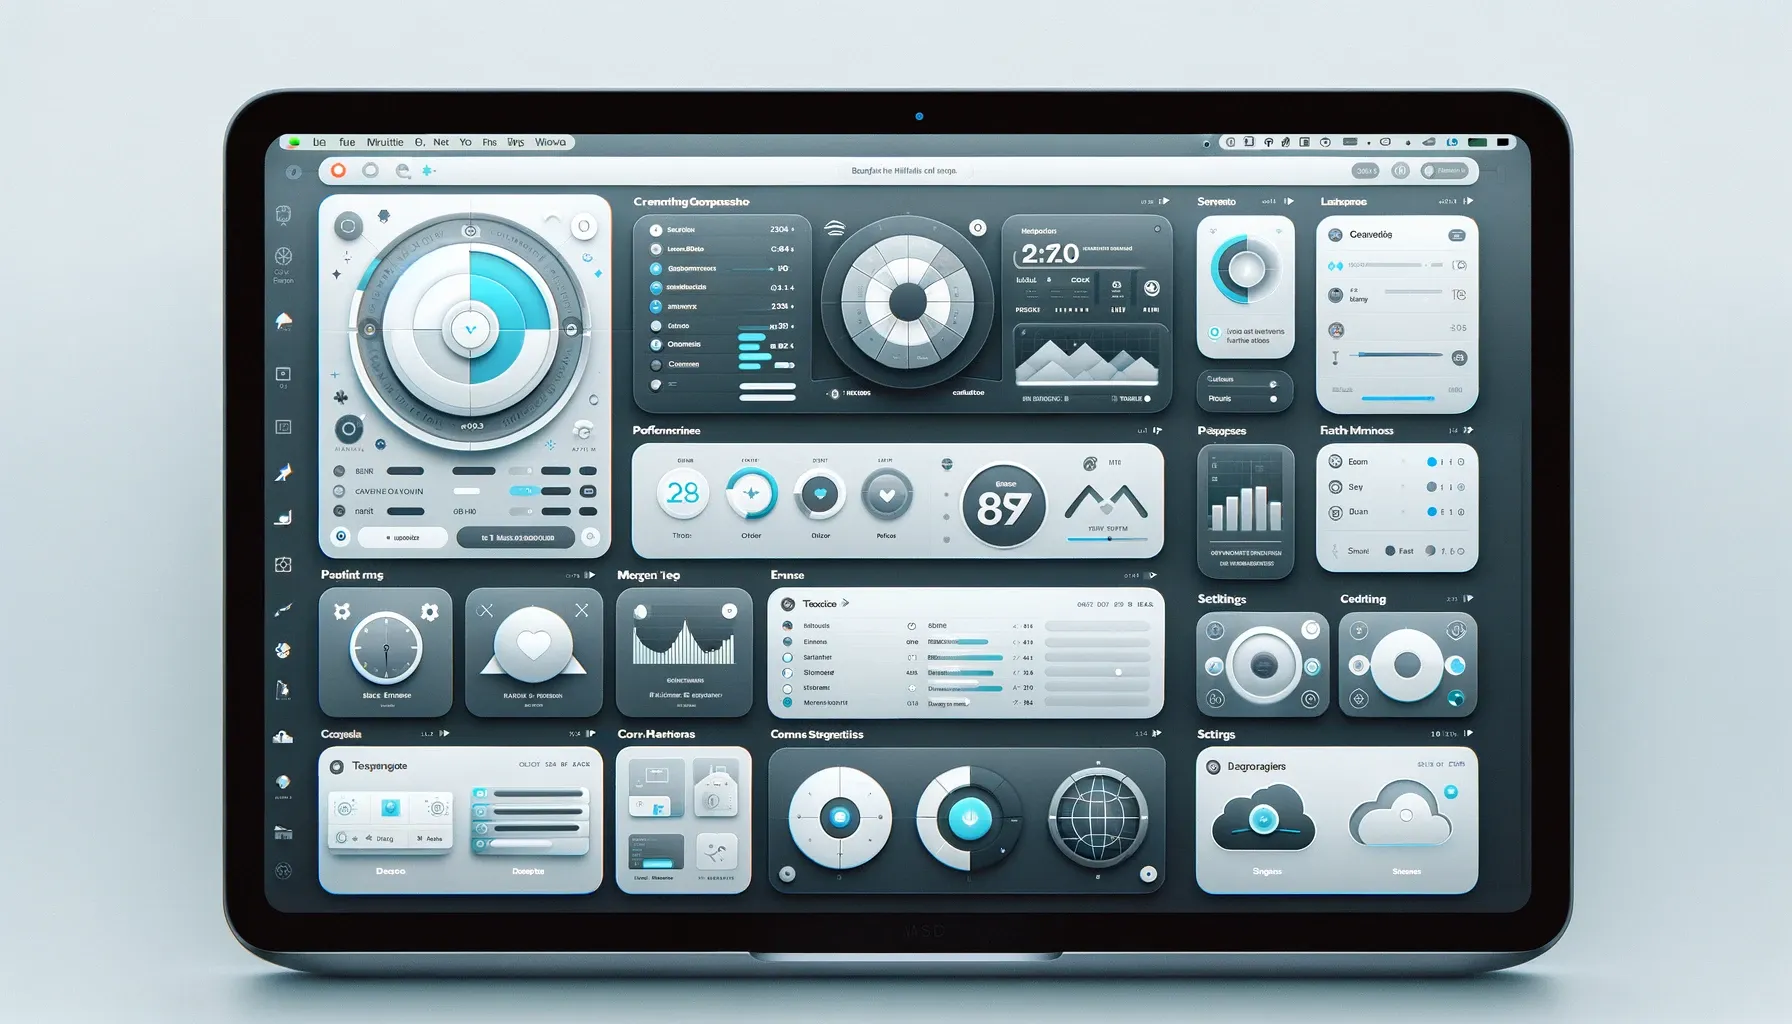
Below is a curated list of 22 open-source system monitor apps and device information scanners for Linux users.
1- Monitorets
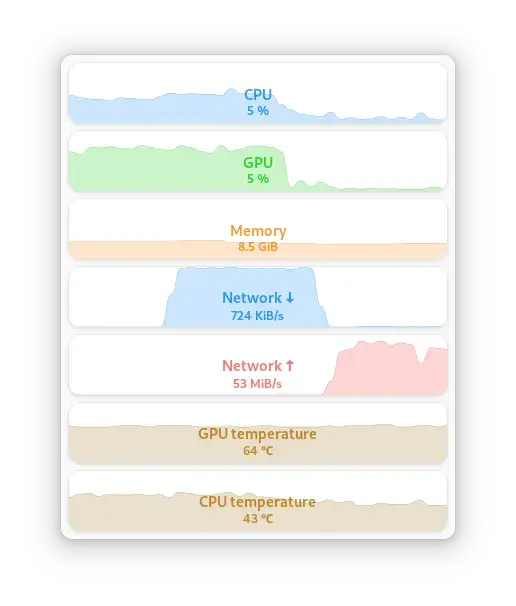
Monitorets is a small utility application offering a simple and quick view at the usage of several of your computer resources. Almost like an applet or a widget for your desktop.
You can download it from Flathup as a Flatpak package.
Available monitors
- CPU
- GPU (experimental support)
- Memory
- Swap
- Network downlink traffic
- Network uplink traffic
- Home folder space
- Root space
- CPU, Memory and I/O pressure
- Temperature sensors
2- Nagstamon
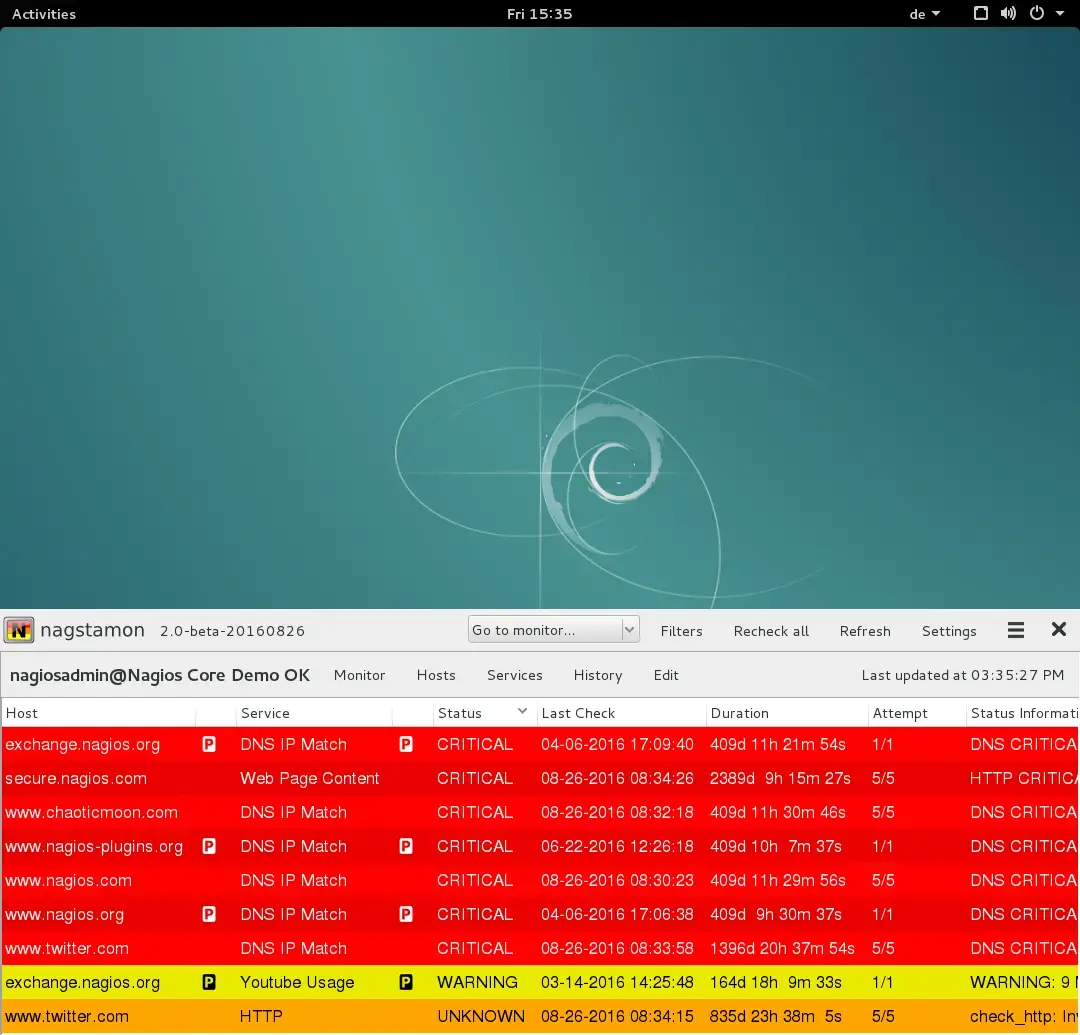
Nagstamon is a status monitor for Linux desktops. It connects to multiple Nagios, Icinga, Opsview, Centreon, Op5 Monitor/Ninja, Check_MK Multisite and Thruk monitoring servers.
It resides in systray, as a floating statusbar or fullscreen at the desktop showing a brief summary of critical, warning, unknown, unreachable and down hosts and services.
It pops up a detailed status overview when being touched by the mouse pointer. Connections to displayed hosts and services are easily established by context menu via SSH, RDP, VNC or any self defined actions.
System users can be notified by sound. Hosts and services can be filtered by category and regular expressions.
Key Features
- connects to multiple monitoring servers
- resides in systray, as a floating statusbar or fullscreen at the desktop
- showing a brief summary of critical, warning, unknown, unreachable and down hosts and services
- pops up a detailed status overview when being touched by the mouse pointer
- connections to displayed hosts and services are easily established by context menu
- actions can be triggered via SSH, RDP, VNC or any self defined connection
- users can be notified by sound and flashing window
- hosts and services can be filtered by category and regular expressions
You can download it as a Flatpak package here.
3- Resources
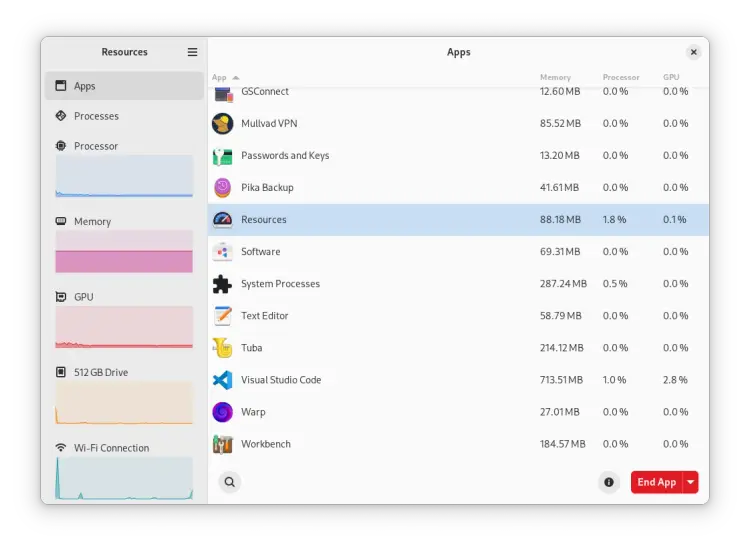
The Resources app enables you to check the utilization of your system resources and control your running processes and apps. It’s designed to be user-friendly and feel right at home on a modern desktop by using GNOME’s libadwaita.
It is available for Arch Linux, Fedora, Ubuntu, Debian and Manjaro.
Install
flatpak install flathub net.nokyan.ResourcesResources supports monitoring the following components:
- CPU
- Memory
- GPU
- Network Interfaces
- Storage Devices
4- CoreStats
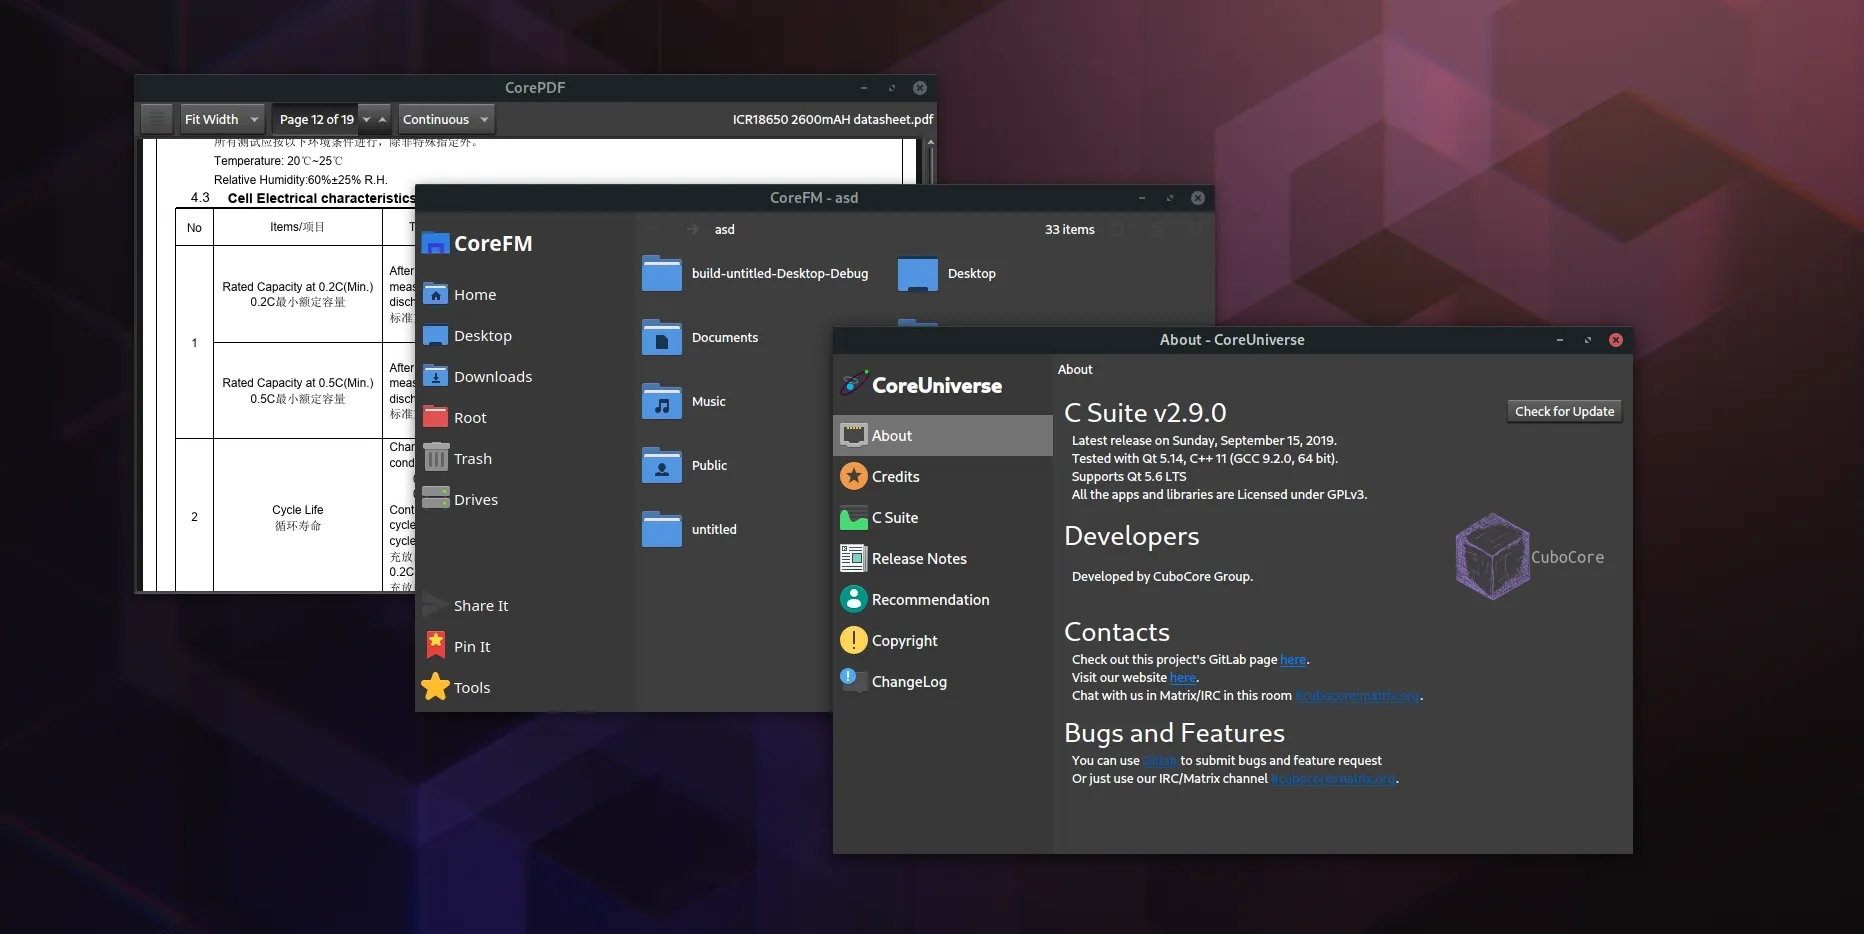
CoreStats is a free system statistics viewer. You can monitor the CPU, RAM, Network and Disk IO statistics from here. It is also possible to view the device info and mount or unmount removable devices, view battery statistics and get information about the display.
Download from Flatpak here.
5- Inspector
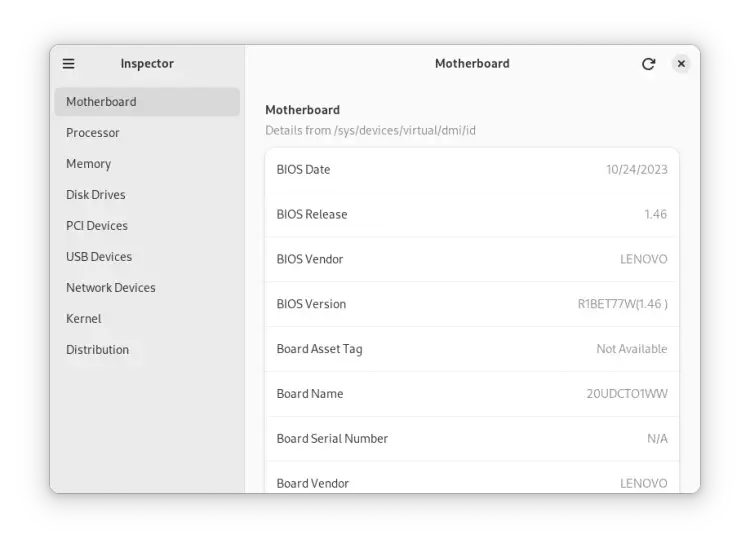
This app enables you to view information about: Usb devices, Disk, Memory, PCI devices, Network, CPU, Motherboard and bios, System and distro. You can get it for free from Flathub as a Flatpak or a Snap package.
6- htop
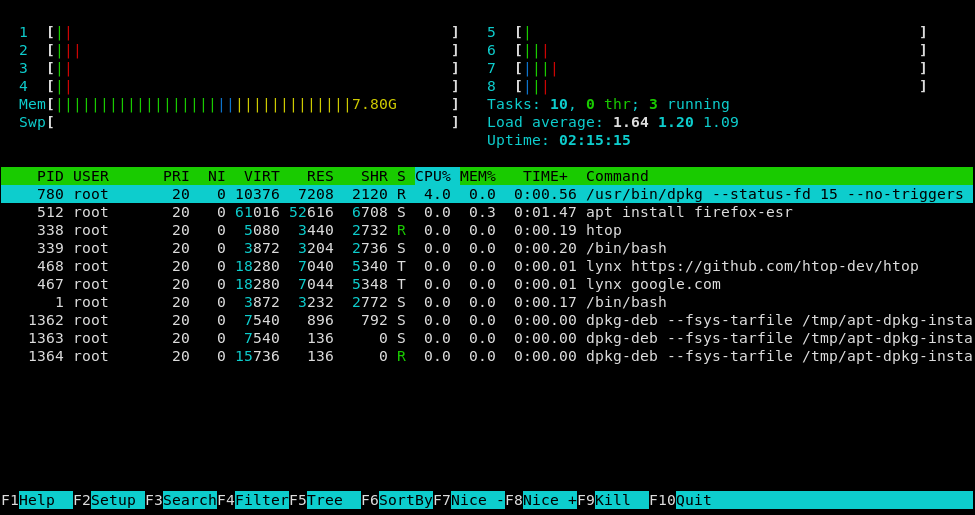
htop is an interactive process viewer for Unix/ Linux systems, offering a user-friendly alternative to the standard top command. It displays system processes in a colorful, organized manner, showing CPU, memory, and swap usage.
System users can easily manage processes, including stopping or renicing them, using keyboard shortcuts. htop supports custom configurations, filtering, and sorting for enhanced usability.
It is written using the C language, and uses ncurses for UI.
It also works on macOS as a charm.
7- Netdata (Linux Server Monitor)
Netdata is a high-performance, cloud-native, and on-premises observability platform designed to monitor metrics and logs with unparalleled efficiency. It delivers a simpler, faster, and significantly easier approach to real-time, low-latency monitoring for systems, containers, and applications.
Netdata requires zero-configuration to get started, offering a powerful and comprehensive monitoring experience, out of the box.
8- atop
Atop is a comprehensive ASCII performance monitor for Linux that tracks system and process activities. It logs performance data over time, highlighting overloaded resources using colors. At regular intervals, it provides detailed insights into CPU, memory, swap, disk, and network activity, along with metrics for each process and thread.
Optional modules like netatop and atopgpud extend its capabilities to monitor network and GPU activity. It can also display cgroup-level resource consumption, enhancing resource management and analysis.
9- byptop
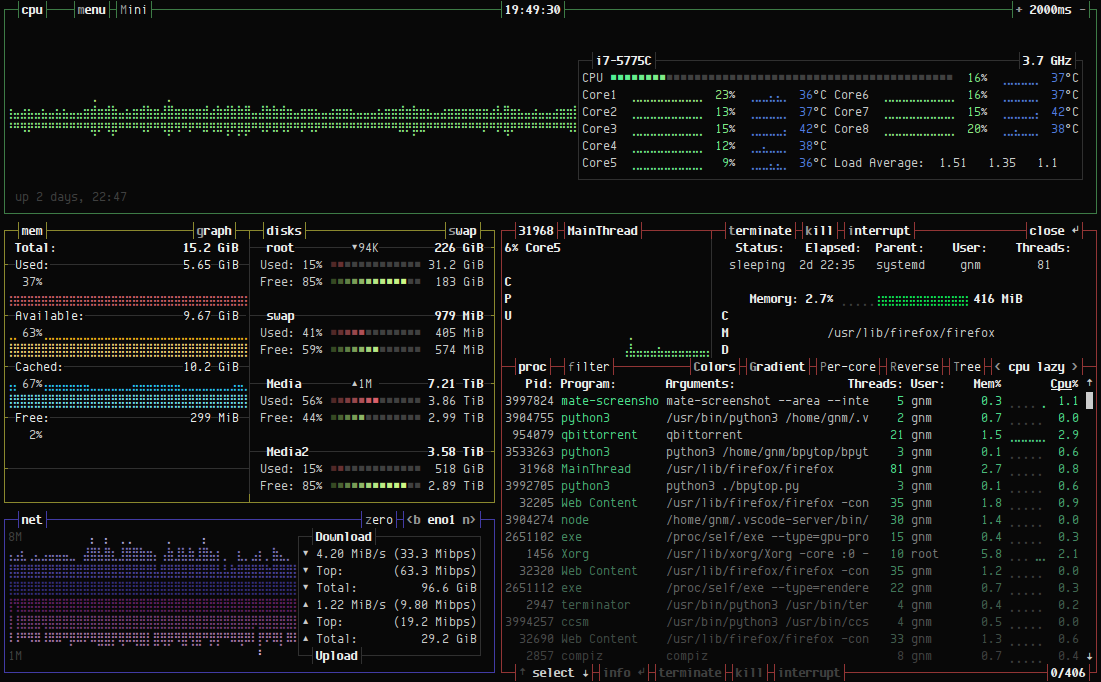
bpytop is a Python-based resource monitor that provides a visually appealing and user-friendly interface for tracking system performance. It displays real-time information about CPU, memory, disk, and network usage, along with detailed process management features.
Hazem Abbas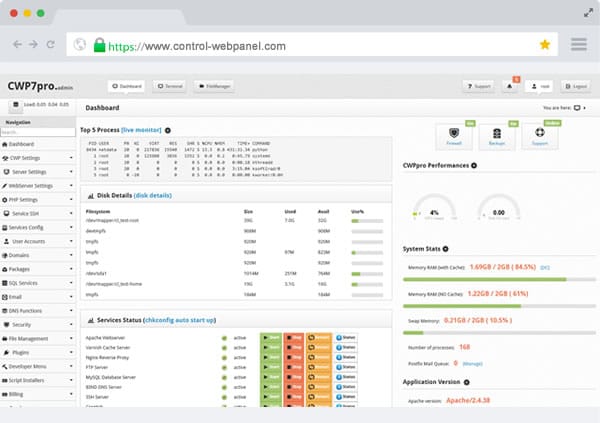
10- bashtop
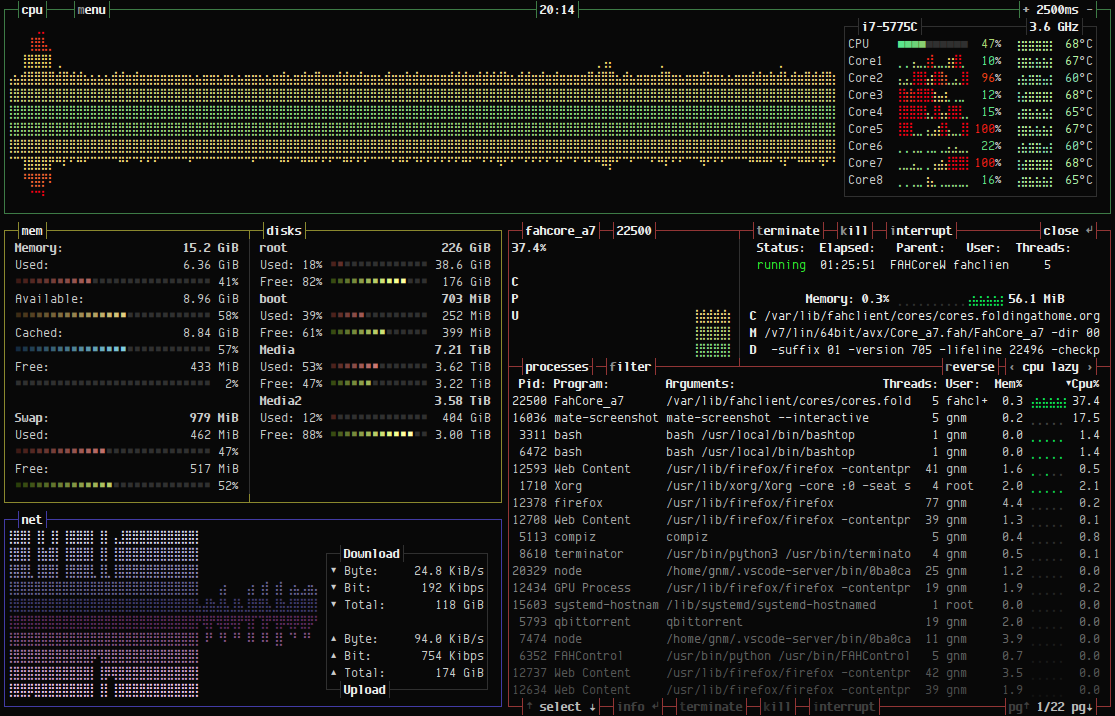
Yet another Linux resource monitor that shows usage and stats for processor, memory, disks, network and processes.
Its features include:
- Easy to use, with a game inspired menu system.
- Fast and "mostly" responsive UI with UP, DOWN keys process selection.
- Function for showing detailed stats for selected process.
- Ability to filter processes.
- Easy switching between sorting options.
- Send SIGTERM, SIGKILL, SIGINT to selected process.
- UI menu for changing all config file options.
- Auto scaling graph for network usage.
- Shows message in menu if new version is available
- Shows current read and write speeds for disks
- Multiple data collection methods which can be switched if running on Linux
11- btop
Btop is an advanced terminal resource monitor designed for Linux, macOS, and Windows. It provides real-time insights into system performance, showcasing CPU, memory, disk, and network usage through an intuitive, graphical interface. Users can customize themes and configure sorting, filtering, and viewing options to enhance their monitoring experience.
Key Features:
- Real-time performance metrics
- User-friendly graphical interface
- Detailed process management
- Customizable themes and settings
- Low resource usage
- Easy to use, with a game inspired menu system.
- Full mouse support, all buttons with a highlighted key is clickable and mouse scroll works in process list and menu boxes.
- Fast and responsive UI with UP, DOWN keys process selection.
- Function for showing detailed stats for selected process.
- Ability to filter processes.
- Easy switching between sorting options.
- Tree view of processes.
- Send any signal to selected process.
- UI menu for changing all config file options.
- Auto scaling graph for network usage.
- Shows IO activity and speeds for disks.
- Battery meter
- Selectable symbols for the graphs.
- Custom presets
Hazem Abbas
12- Conky
Conky is a highly customizable lightweight, free system monitor for X, also compatible with Wayland and macOS. It displays various system information directly on your desktop and can output to files or HTTP.
Features included:
- Over 300 built-in objects for OS stats, CPU usage, and network monitoring
- Support for popular music players (MPD, Audacious)
- IMAP and POP3 integration
- Extensible via Lua scripts
- Customizable display with fonts, colors, and widgets
- Compatible with multiple operating systems, including Linux and BSD variants
- Available Docker images for various architectures
Hazem Abbas
13- C++ Linux System Monitor
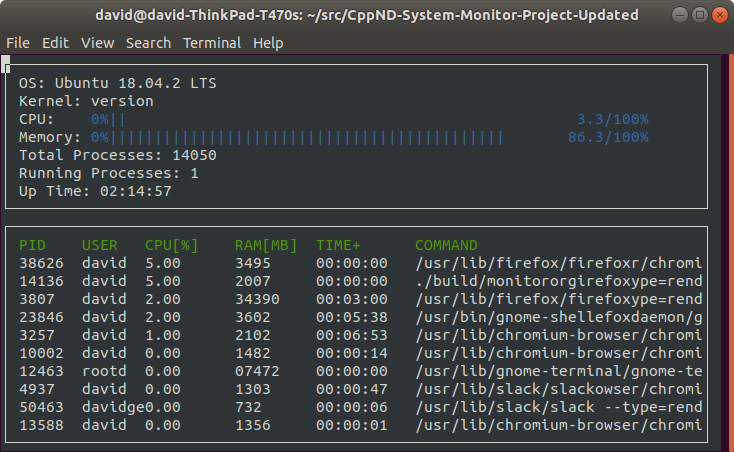
The C++ Linux System Monitor is a graphical tool for monitoring system performance in real-time. It provides insights into CPU usage, memory consumption, and disk activity, allowing users to track and manage system resources effectively.
The application is built using Python and features a user-friendly interface that displays key metrics in an easily digestible format. It supports customizable widgets and can be expanded to include additional monitoring features as needed.
14- System Monitoring Center
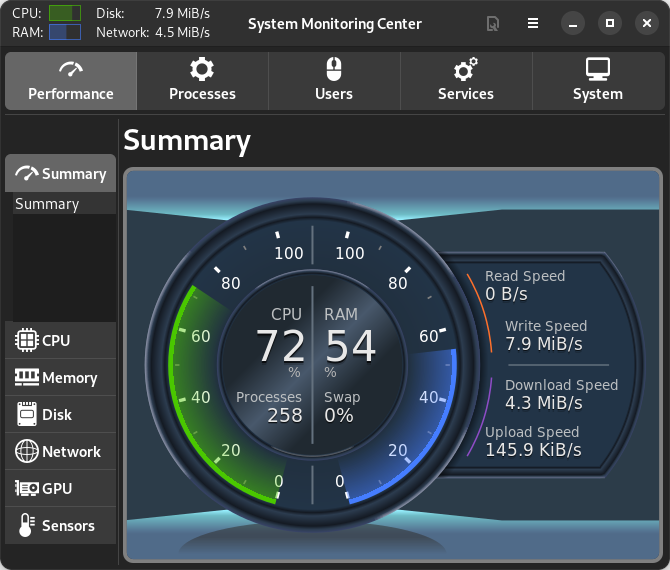
This is a Libre free and open-source Multi-featured system monitor.
Features
- Detailed system performance and usage usage monitoring/managing features:
- Monitoring CPU, RAM, Disk, Network, GPU hardware/usage information
- Monitoring and managing processes and services (systemd)
- Monitoring users, sensors and general system information
- Supports PolicyKit. No need to run the application with "sudo"
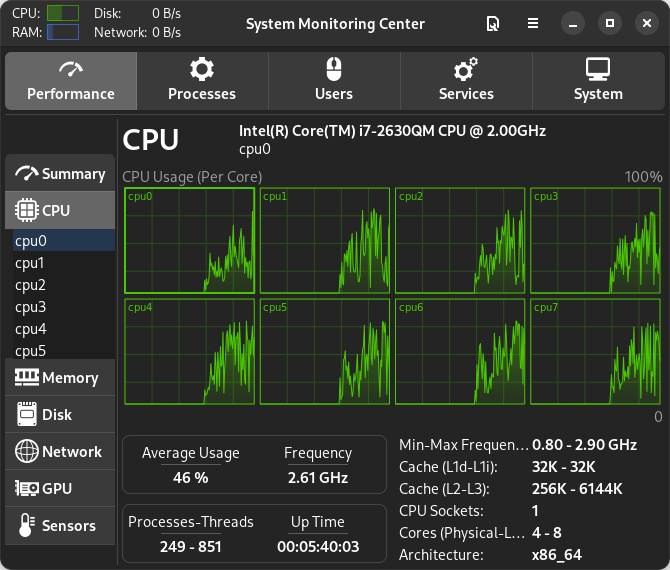
- Hardware selection options (selecting CPU cores, disks, network cards, GPUs)
- Plotting performance data of multiple devices at the same time
- Interactive charts for querying performance data on any point
- Option for showing processes as tree or list
- Optimized for low CPU usage
- Customization menus for almost all tabs
- Supports ARM architecture
- Hardware accelerated GUI
Hazem Abbas
15- bottom (btm), Because Top is not enough
Bottom (btm) is a customizable, cross-platform graphical process and system monitor for the terminal, supporting Linux, macOS, and Windows. Inspired by tools like gtop, gotop, and htop, it provides a modern interface to visualize system metrics.
Bottom's Features (Similar to Top)
- Graphical Visualizations: CPU (average & per-core), RAM, swap, and network I/O usage.
- System Widgets: Disk capacity/usage, temperature sensors, battery status.
- Process Management: Sorting, searching, kill signals, tree mode.
- Customization: Command-line options, config file settings, color themes, widget behavior.
- Modes: Basic htop-inspired mode and focused widget expansion.
16- Simple System Monitor
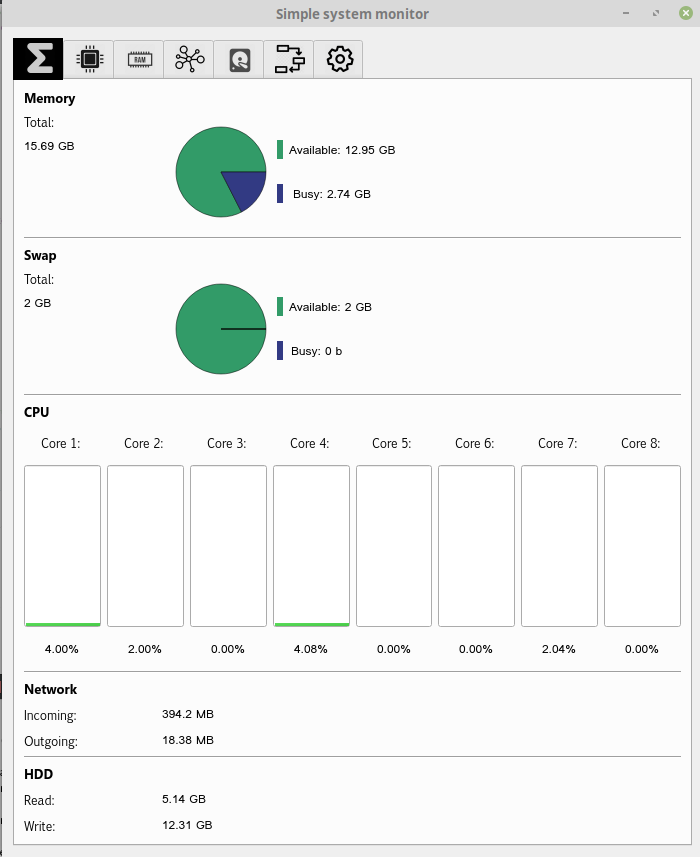
Simple System Monitor is a lightweight and straightforward monitoring tool for Linux that displays system information such as CPU usage, RAM, and disk space. The application features a user-friendly interface and allows real-time tracking of system performance.
17- Sysmon
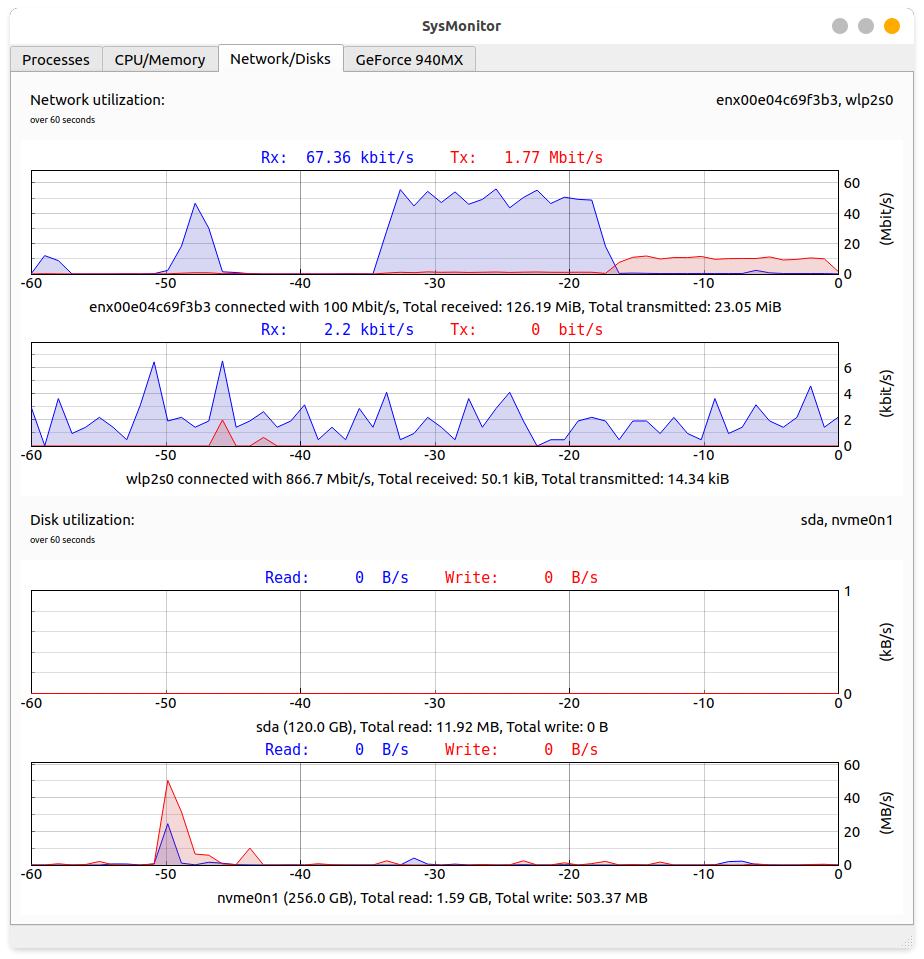
Sysmon is a graphical system monitor for linux, including information about CPU, GPU, Memory, HDD/SDD and your network connections. Similar to windows task manager.
Hazem Abbas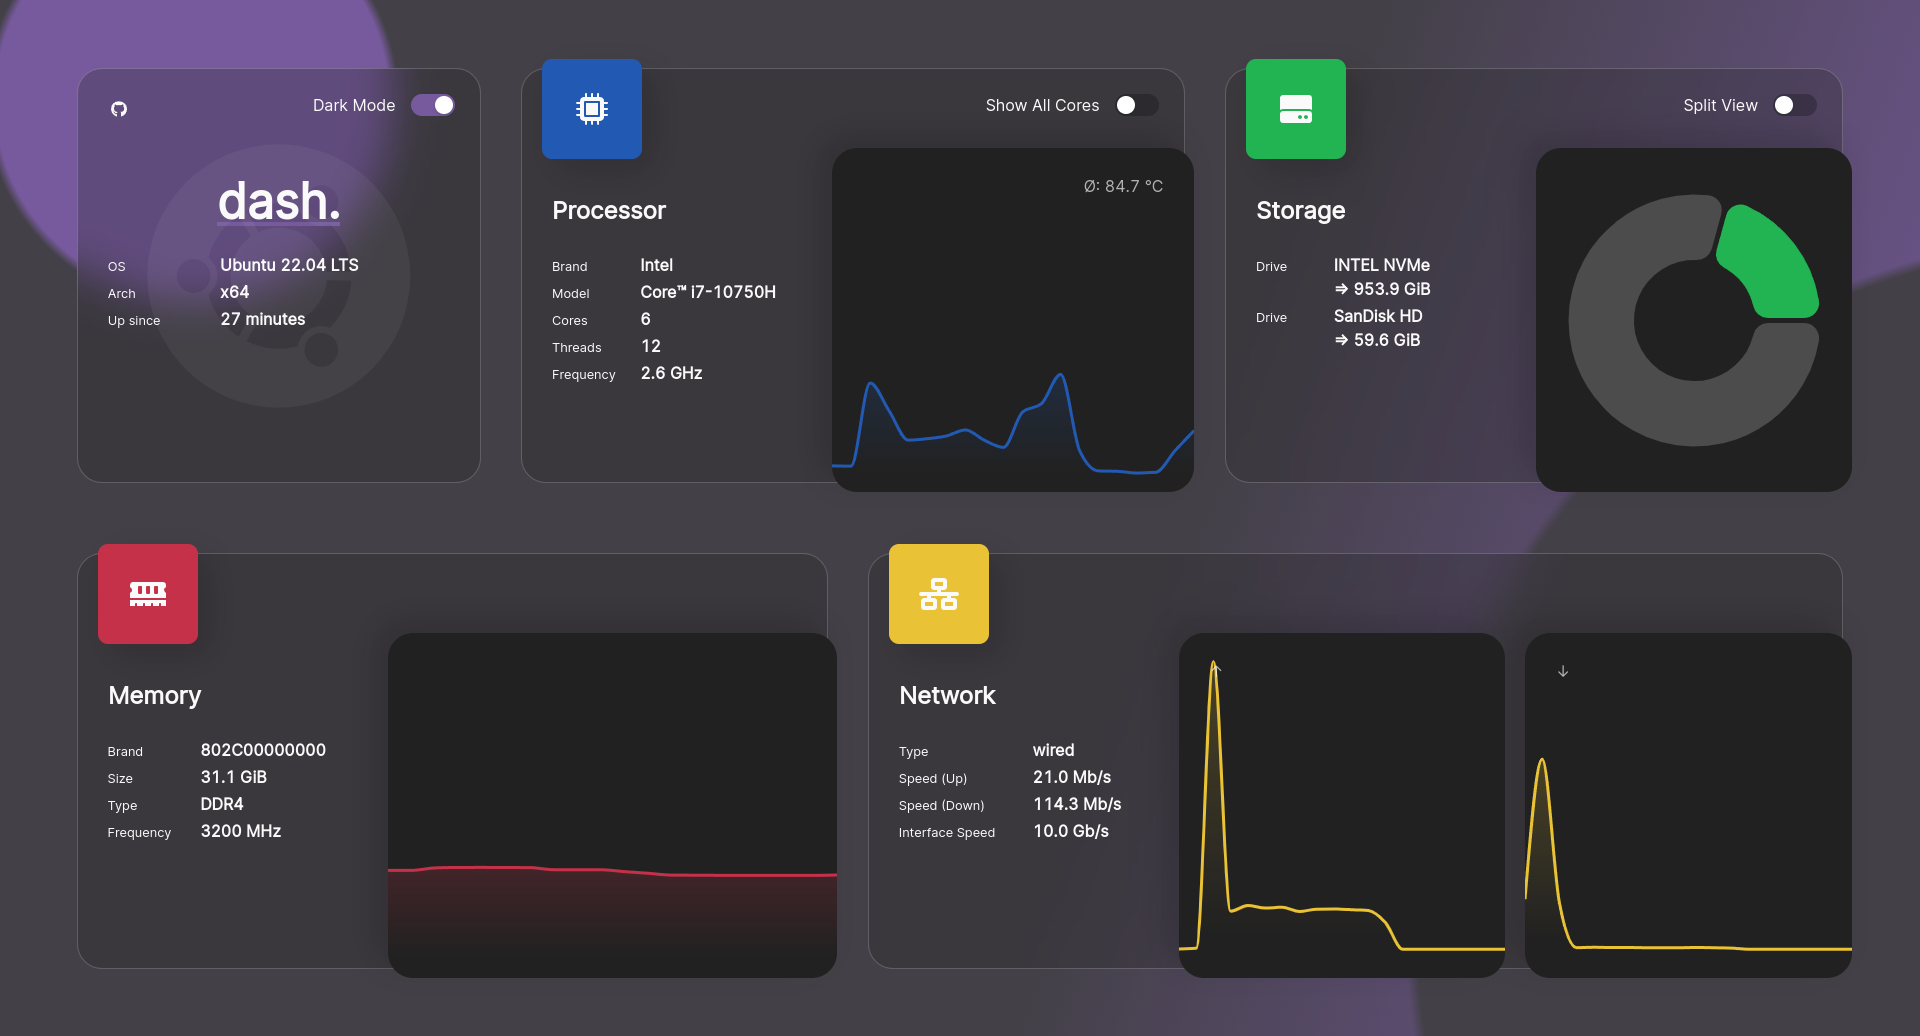
18- Monitor (for elementary OS)
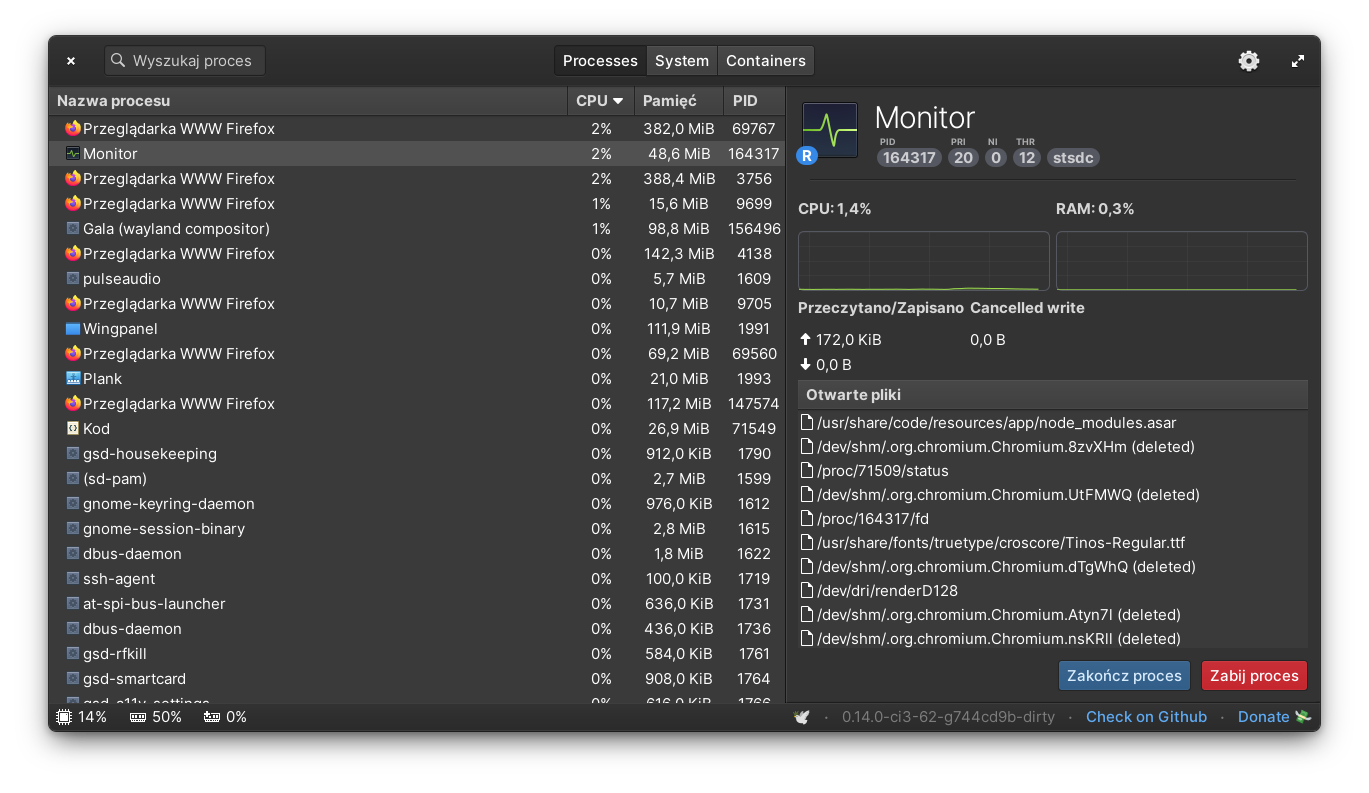
Monitor is a system monitoring application developed for the elementary OS. It provides users with a clean and simple interface to track system performance metrics, such as CPU, memory, and network usage. The application emphasizes usability and aesthetics, allowing users to gain insights into their system's health at a glance
19- vtop
vtop is a terminal-based visual tool for monitoring system resources, designed to display CPU and memory usage in real time. With an appealing interface that utilizes ASCII graphics, it offers detailed insights into running processes. Users can easily navigate the application using mouse support and keyboard shortcuts, making it intuitive to use.
It is written in JavaScript, and can run on Linux, Unix and macOS systems.
20- Status
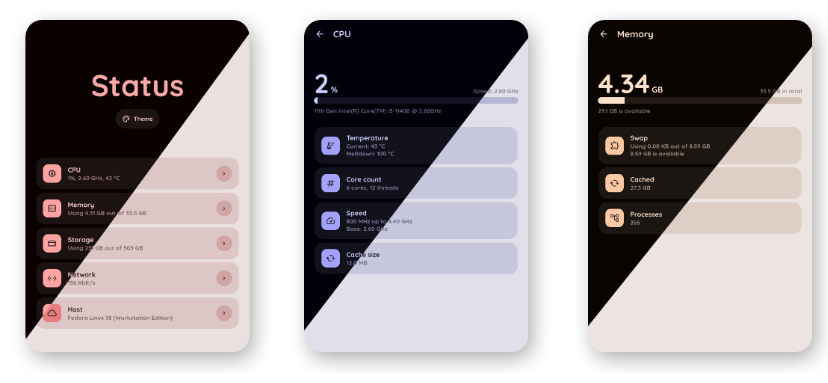
Status is a simple, lightweight system monitoring app for small home servers running Linux. It utilizes virtual filesystems (like /sys, /proc etc.) to retrieve information and give it to end user via nice web interface.
It is written using Python, and can be easily installed on any Linux distros and using Docker.
It comes with a Web UI and can also run smoothly on Raspberry Pi.
Hazem Abbas
21- gotop
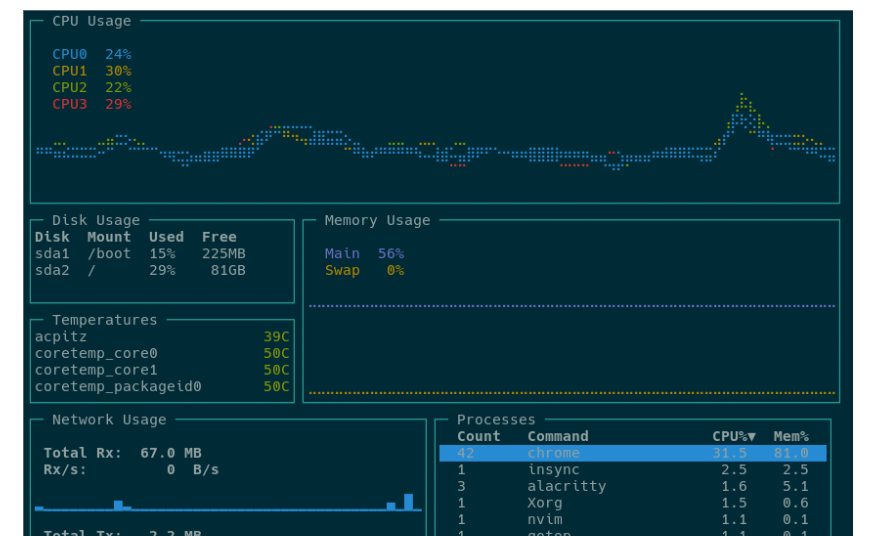
gotop is a terminal-based graphical monitoring tool that displays real-time system statistics like CPU, memory, and network usage. It features an intuitive interface inspired by traditional top tools, enhanced with colorful visualizations for easy data interpretation.
You can navigate using keyboard shortcuts and interact with process management functionalities.
Hazem Abbas
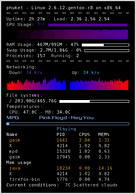
22- nmon
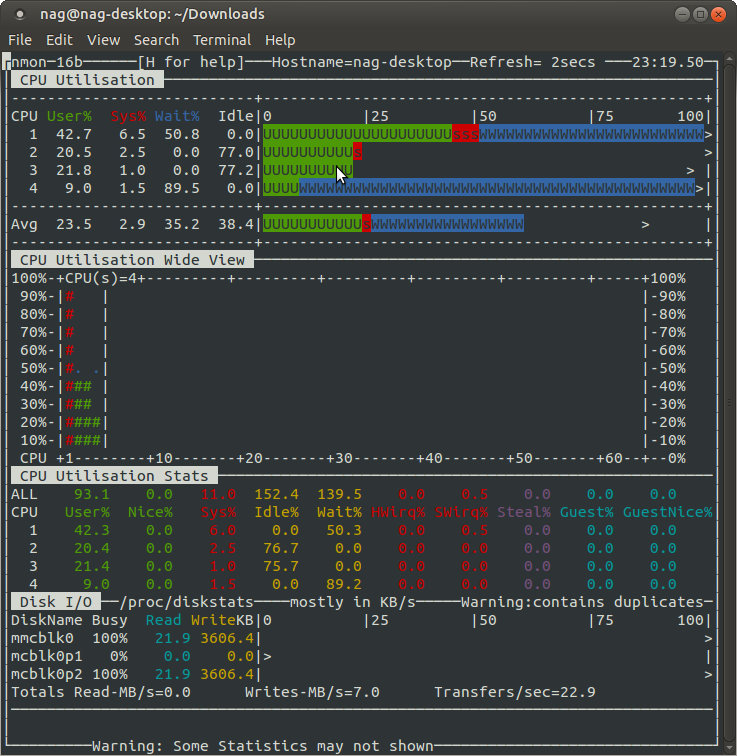
Nmon (Nigel's Monitor) is a performance monitoring tool for Linux and AIX systems, providing real-time data on various system metrics. It displays information about CPU, memory, disk, and network usage, helping users identify performance bottlenecks.
Nmon can generate performance reports for analysis, making it a valuable tool for system administrators and developers.