11 Free Network Management and Monitoring Tools for Enterprise
Table of Content
What is a network management and monitoring app?
Open-source network management and monitoring tools like Nautobot, NetBox, OpenNMS, NETworkManager, Gondul, Meshtastic Network Management Client, ZenNMS, MnMs, OpenEye, and Network Traffic Analyzer can significantly enhance network visibility for enterprises.
They offer functionalities such as network documentation, fault monitoring, performance measurements, and real-time monitoring, facilitating better decision-making and problem-solving.
Here, we present 11 open-source network management and monitoring tools that enterprises can leverage for efficient network operation.
1. Nautobot
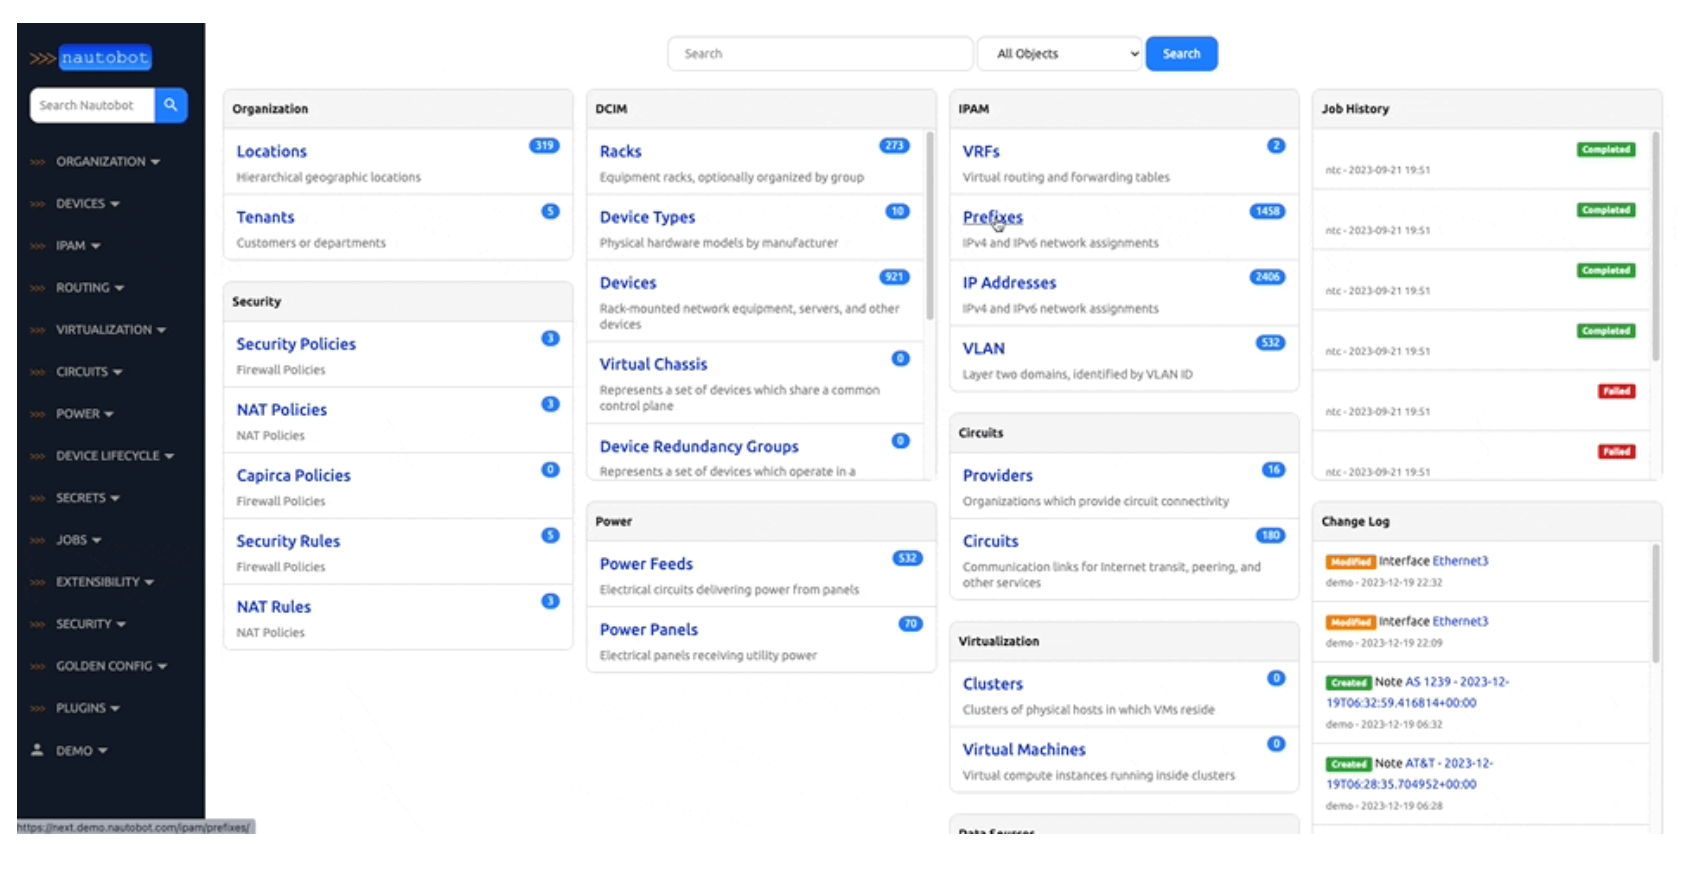
Nautobot is a self-hosted Network Source of Truth and Network Automation Platform built on the Django Python framework. It serves as a flexible source of truth for networking, with core data models defining the intended state of network infrastructure.
It offers maximum data model flexibility through user-defined relationships, custom fields on any model, and data validation that allows for codification of standards and automated tests.
2. Netbox
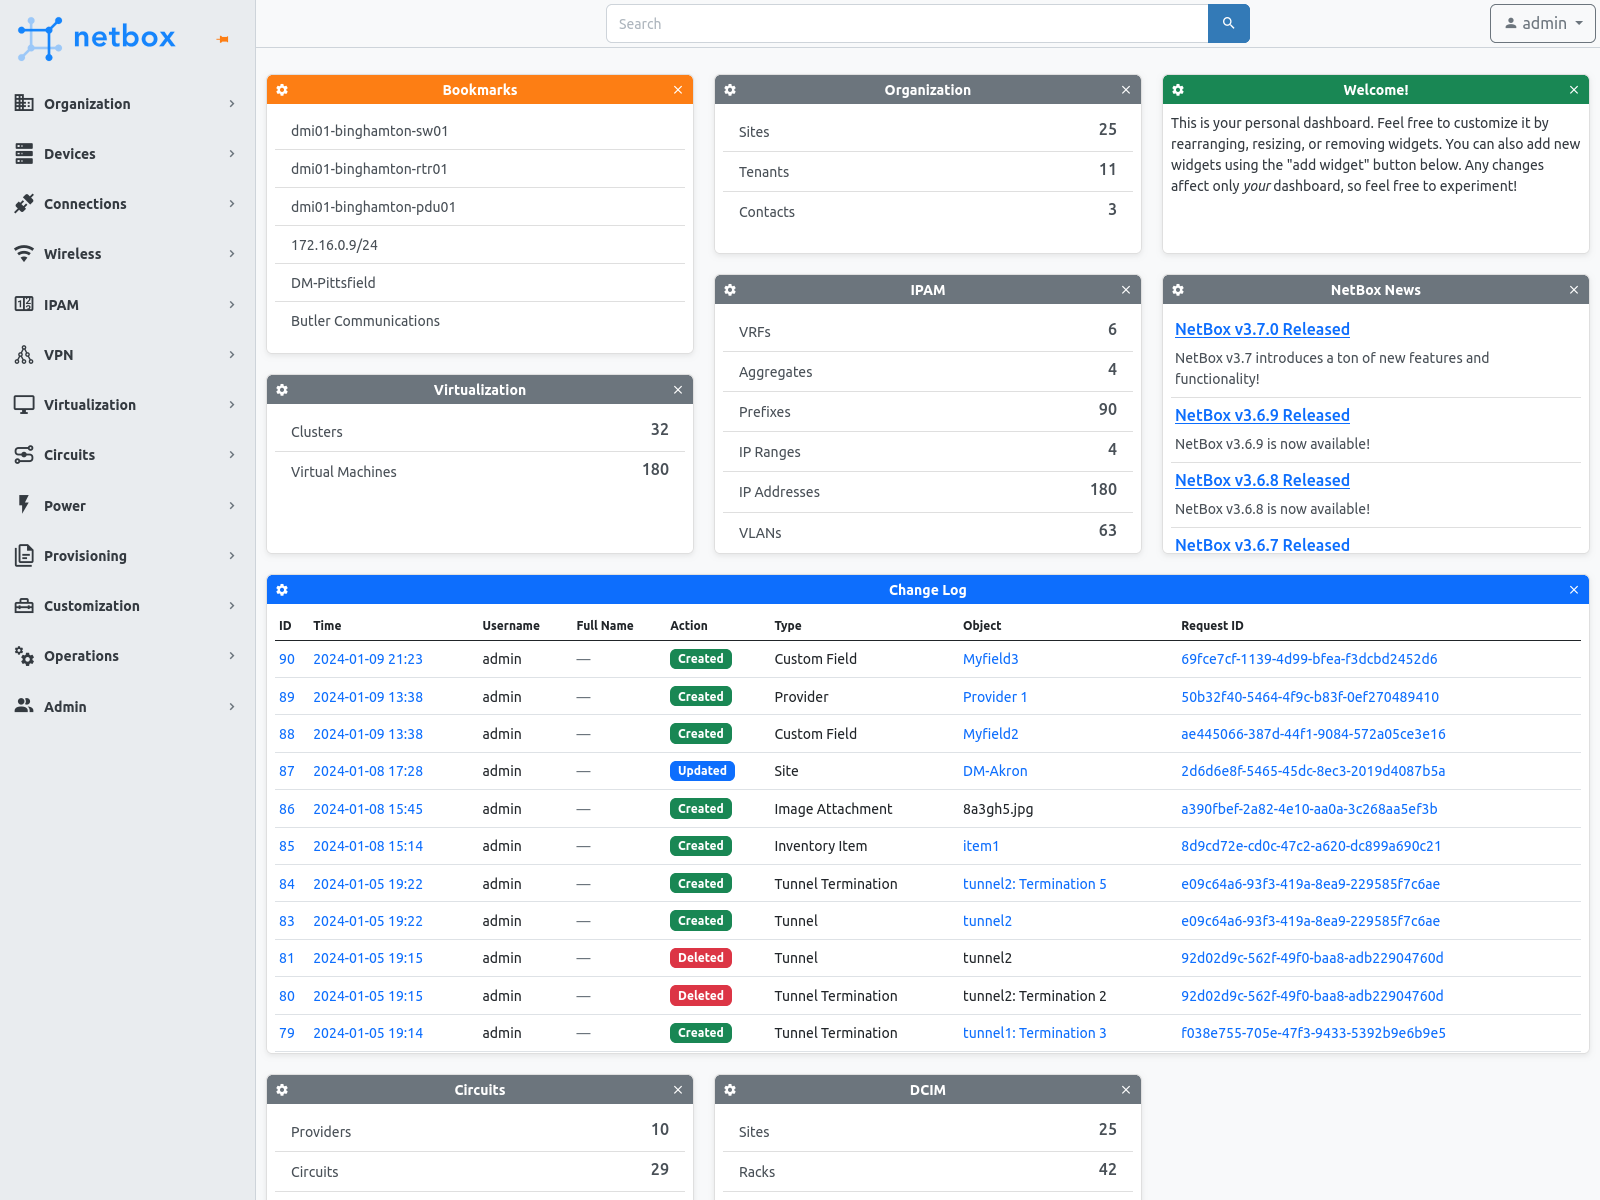
NetBox, released in 2016, has become a popular solution for modeling and documenting network infrastructure. It provides a comprehensive and accessible data model for networking, replacing legacy IPAM and DCIM applications. NetBox offers a robust user interface and programmable APIs for various network aspects, serving as the central source of truth for modern networks.
3. OpenNMS
OpenNMS is an open-source network monitoring platform offering comprehensive fault, performance, and traffic monitoring with alarm generation. It is highly customizable, scalable, and integrates with core business applications and workflows.
4. NETworkManager
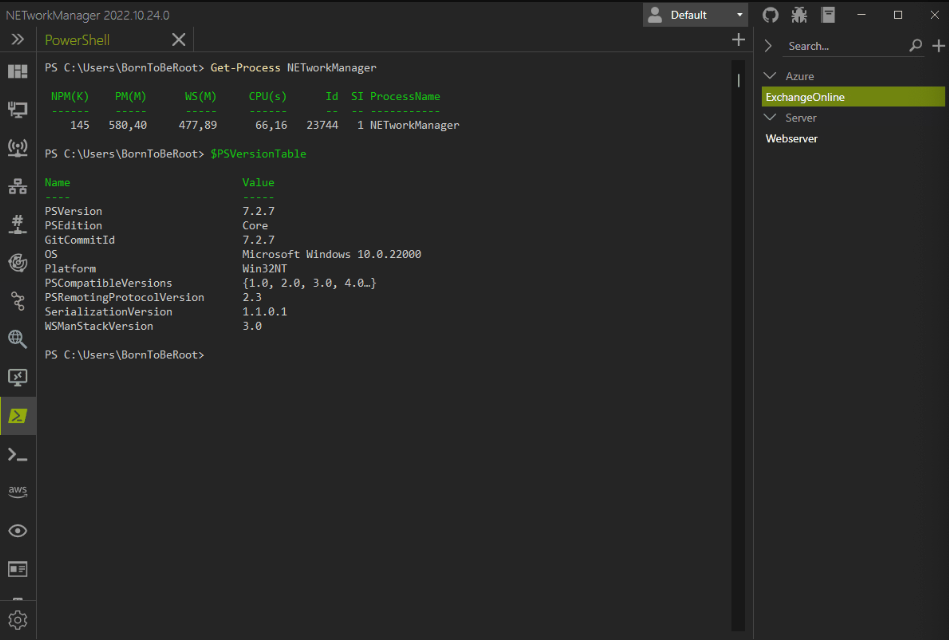
NETworkManager is a powerful, open-source tool for managing networks and troubleshooting network problems. It allows for remote system management via Remote Desktop, PowerShell, PuTTY, TigerVNC, or AWS Session Manager.
It also offers features for network and system analysis, such as WiFi Analyzer, IP Scanner, Port Scanner, Ping Monitor, Traceroute, DNS lookup, and LLDP/CDP capture. Users can save hosts or networks in encrypted profiles for use across all features.
NETworkManager is written with C# and released under the GNU General Public License v3.
5. NMIS

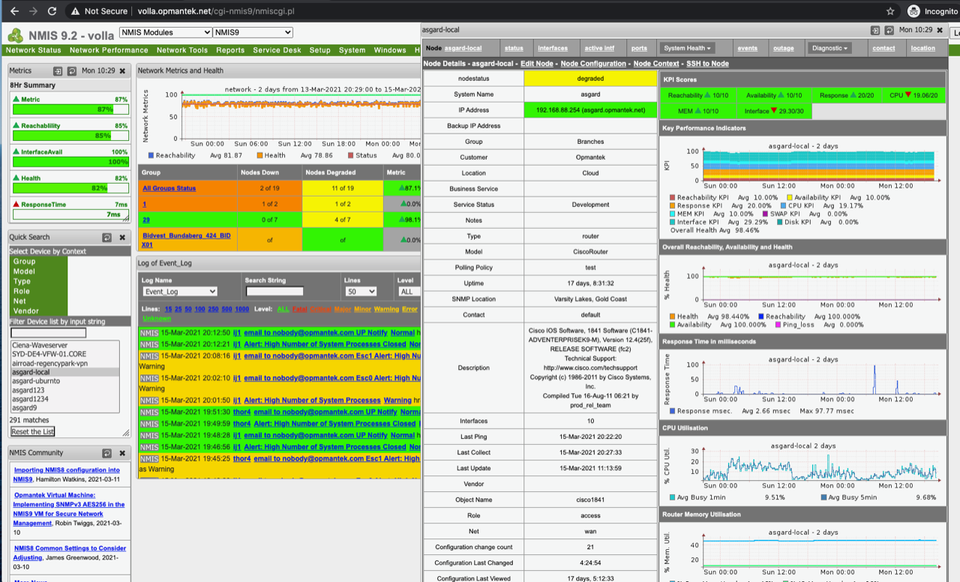
Since its initial release in 1998, NMIS (Network Management Information System) has firmly established itself as a reliable open-source network management system. Vigilantly monitoring the status and performance of an organization's IT environment, NMIS aids in the swift identification and rectification of faults.
It also generates crucial information that empowers IT departments to strategically plan expenditures and implement IT changes. To further enhance NMIS's capabilities, additional modules and support are readily available from Opmantek.
Features
- Configuring NMIS for Multi-Tenancy
- NMIS and multi-homed nodes
- Customising Interface Speed, Collection, Thresholds and Events Using Node Configuration
- Managing Current Events - acknowledgement to stop escalation and notification
- Basic and Advanced Thresholds in NMIS8
- NMIS Threshold Configuration
- NMIS Metrics, Reachability, Availability and Health
- Performance Data Storage in NMIS8
- NMIS Event Log
- NMIS Event List
- NMIS Node Status
- Importing Nodes into NMIS8 - bulk import and integration
- Alerts - Using models to generate custom events
- Creating NMIS Email Notifications for a Specific Node and Interface
- Configuration Files for NMIS
- Custom Tables in NMIS
- Using Unique Identifiers (UUID) for NMIS Nodes
- Custom Notification Methods for NMIS Events
- NMIS Dashboards with Alternate Groupings - Customers and Business Services
- Developing Device Models for NMIS
- NMIS Model Policy
- Modelling for WMI
- Device Modelling Checklist
- Modelling MIBS that use Indexes using the systemHealth section
- Advanced Modelling: When a single SNMP variable isn't enough
- NMIS Collect and Update Plugins for Flexible Data Collection
- Extending SNMPd for custom monitoring
- Making Sounds for Critical Events on the NMIS Dashboard
- How NMIS pings nodes, using fpingd/fping or ping
- Ping Timeout and NMIS, including fast ping - fping
- Scaling NMIS Polling
- Customising the NMIS Dashboard Layout - Save Windows and Positions
- Controlling the Collection of Interfaces, Adjustments and Overrides
- Configuring syslog to get 'Network Events' on Primary Server
- Scaling NMIS polling - how NMIS handles long running processes
- NMIS Handling Counter64 using SNMPv1
- Linking Nodes to other systems including Web, SSH, Telnet and whatever you need
- Handling Uptime Counter Wrap with snmpEngineTime instead of sysUpTime

6. Gondul
Gondul is a network monitoring and management system designed for large-scale events like The Gathering. Unlike other systems, Gondul is not meant to run perpetually, but for a limited time with minimal infrastructure.
It can be installed for similar events of various scales, with system requirements being minimal. It can run on a single VM or be split based on roles, and while the database is used extensively, scaling has been carefully managed.
The caching layer (Varnish) should not be ignored due to its extensive use and ability to invalidate cache properly.
Features
- Collects SNMP and ping-data frequently.
- Per-device configurable SNMP polling-interval
- IPv4 and IPv6 support
- Provides per-port statistics.
- Client-counter (based on active DHCP leases)
- Intelligent, easy-to-use and real-time device search based on name, description (e.g.: sysDescr, so also software versions/models), serial numbers, distribution switches, IP addresses, etc.
- Low-effort operations log with optional device-association, using the same search pattern.
- Intelligent health-map that will alert you of any error without overloading you with information.
- All "map handlers" evaluate a device and return a health score from 0 to 1000 to signify what their opinion of the device's health is. Whatever map handler provides the worst score will be shown.
- Map handlers are trivial to write and exist in pure javascript.
- Some map handlers include:
- Latency (v4/v6)
- Temperature (Cisco and Juniper)
- SNMP sysname versus database sysname-mismatch
- DHCP age (where a client subnet is set)
- Lack of management info (e.g.: missing IPv6 management info)
- Recent reboots
- (more)
- Replay capabilities: Easy to review the state of the network as it was at any given time Gondul was running. And "fast forward" to real time.
- Modular JavaScript front-end that is reasonably easy to adapt
- Templating (using jinja2 and all data available to Gondul, from management information to latency)
- Graphing and dashboards through Graphite
- Huge-ass README that is still not complete.
7. OpenWISP
OpenWISP Monitoring is a network monitoring system, written in Python and Django, that is extensible, programmable, scalable, and user-friendly. Once configured, it automatically performs monitoring checks, alerts, and metric collection.
It can be used as a framework for custom network automation solutions. Other components of the OpenWISP ecosystem include openwisp-controller, openwisp-network-topology, openwisp-firmware-upgrader, openwisp-radius, and openwisp-ipam.
Features
- Extensible, programmable, scalable, and user-friendly
- Automatic monitoring checks, alerts, and metric collection
- Can be used as a framework for custom network automation solutions
- Collection of monitoring information in a timeseries database
- One-click alert browsing from the user interface
- Collection and display of device status information
- Monitoring charts for various metrics
- Maintenance of a record of WiFi sessions
- Viewable charts at various resolutions
- Configurable alerts
- CSV Export of monitoring data
- Network status overview in the admin dashboard
- Ability to configure additional metrics and charts
- Extensible active check system
- Extensible metrics and charts
- API to retrieve the chart metrics and status information of each device
- Iperf3 check for network performance measurements
8. ZenNMS
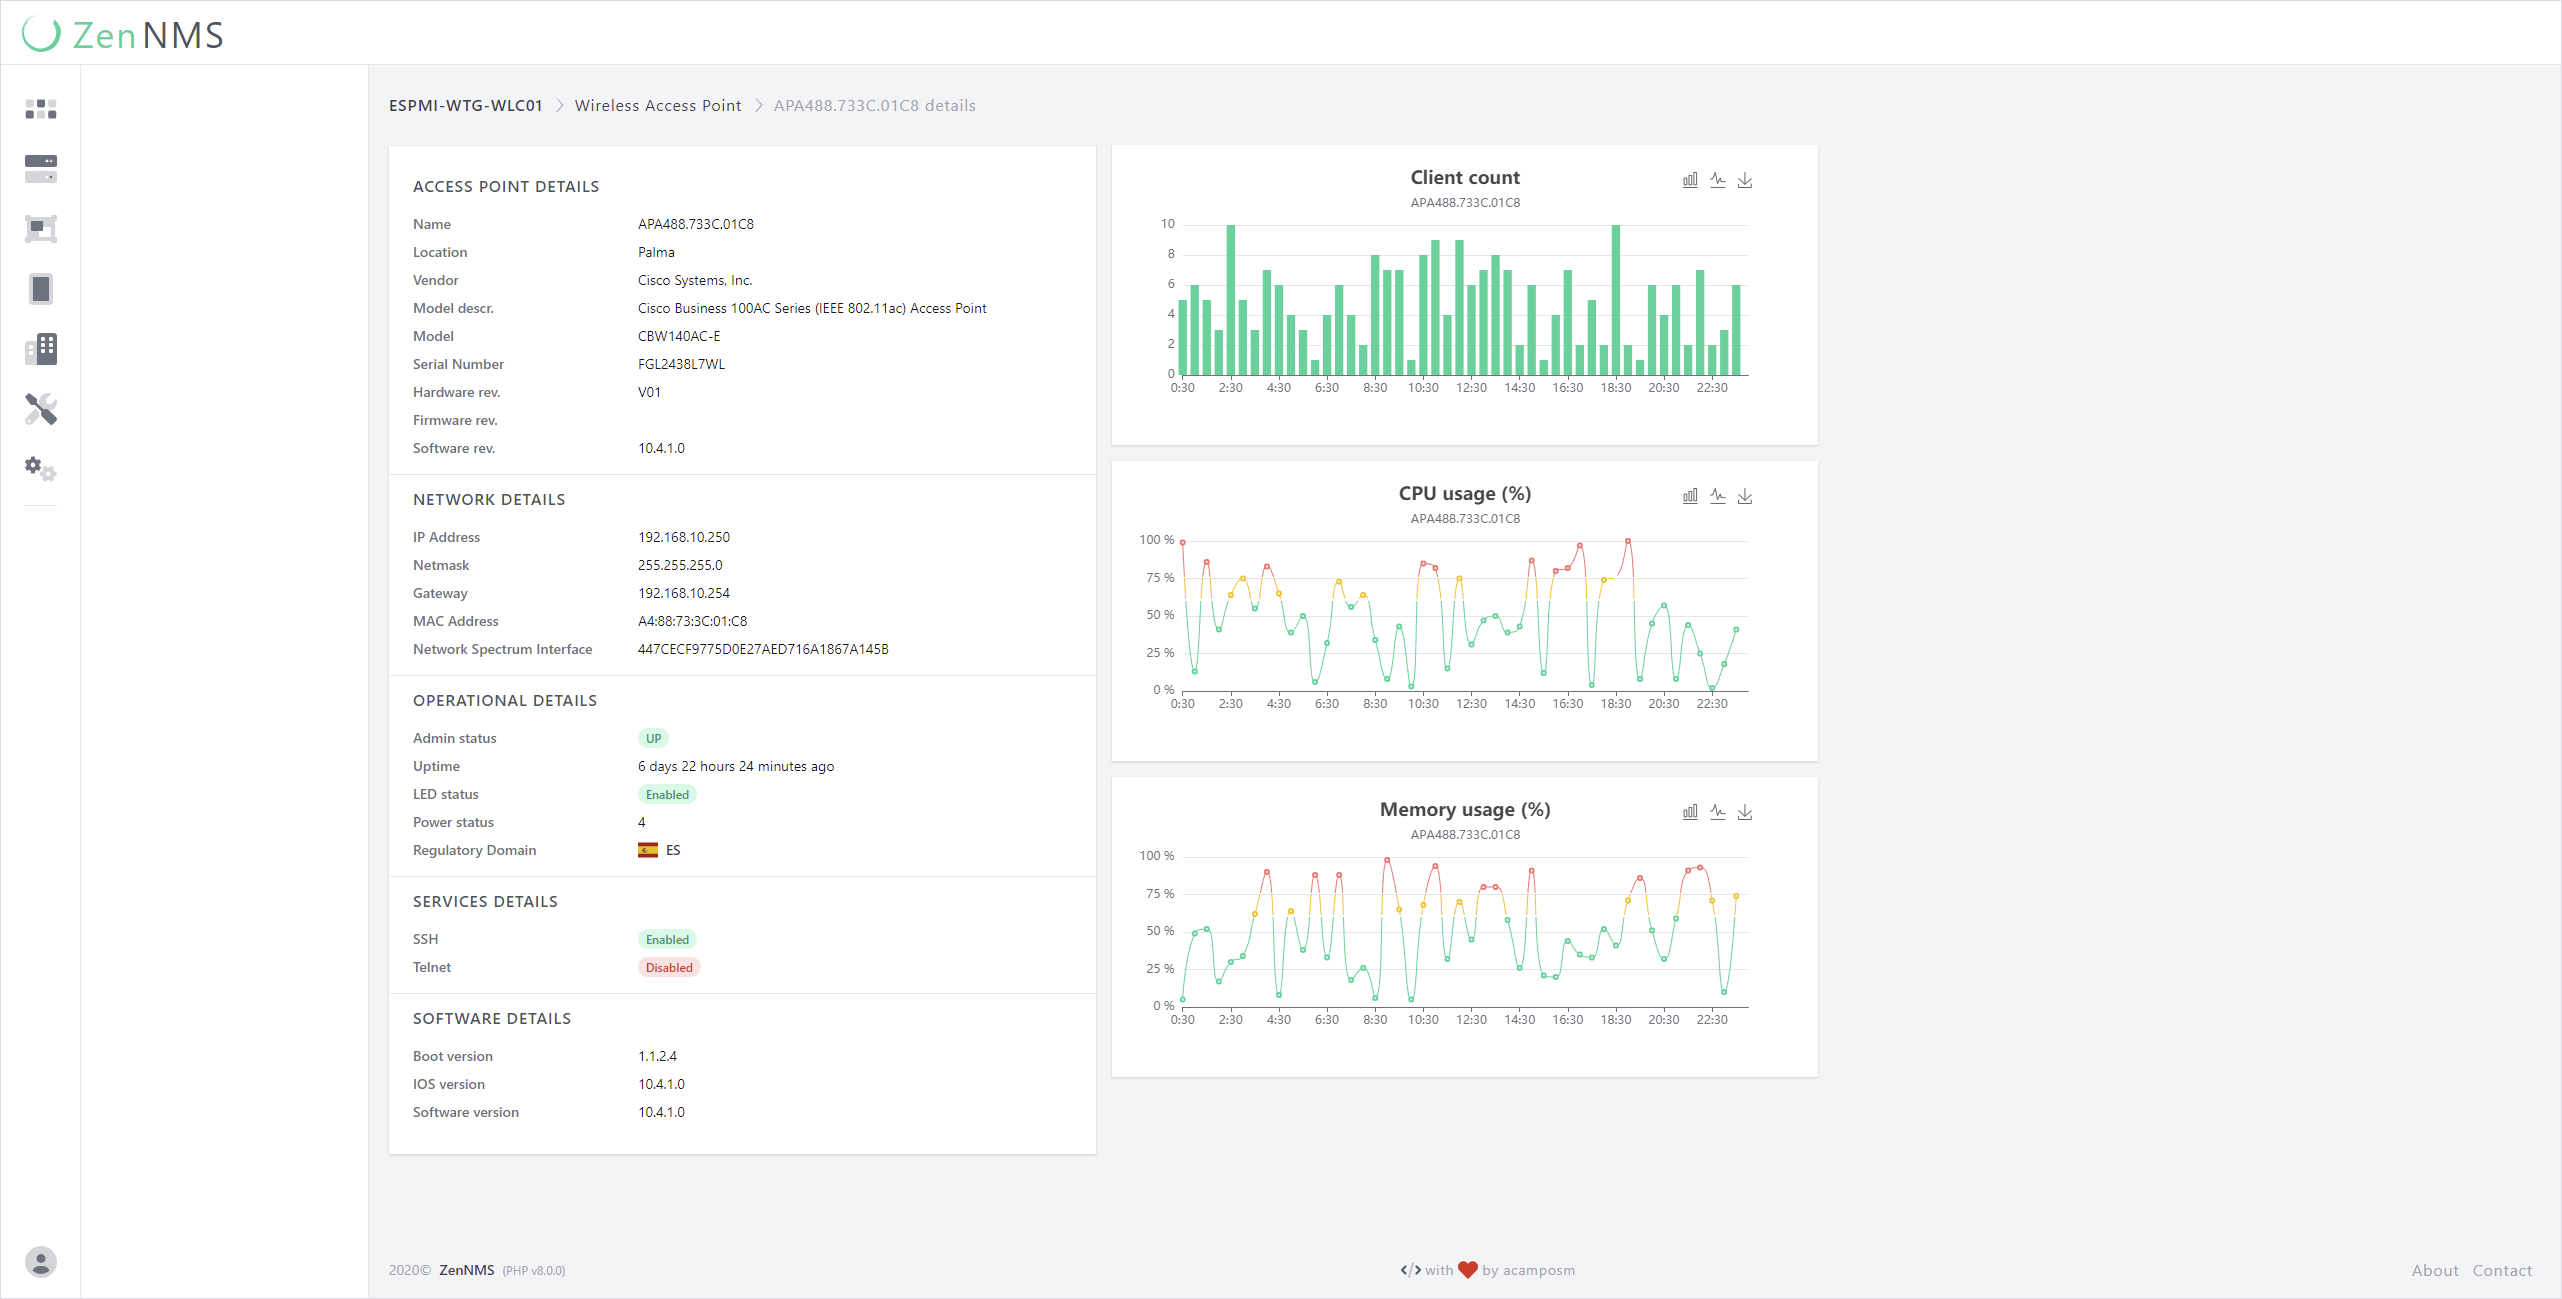
ZenNMS is a self-hosted web-based Network Monitoring System written in PHP and made with Laravel.
Features
- Device management
- Device details
- Device interface
- Device Wireless Access Points
- Wireless Access Points Details
9. MnMs: Media-Network-Manager-System
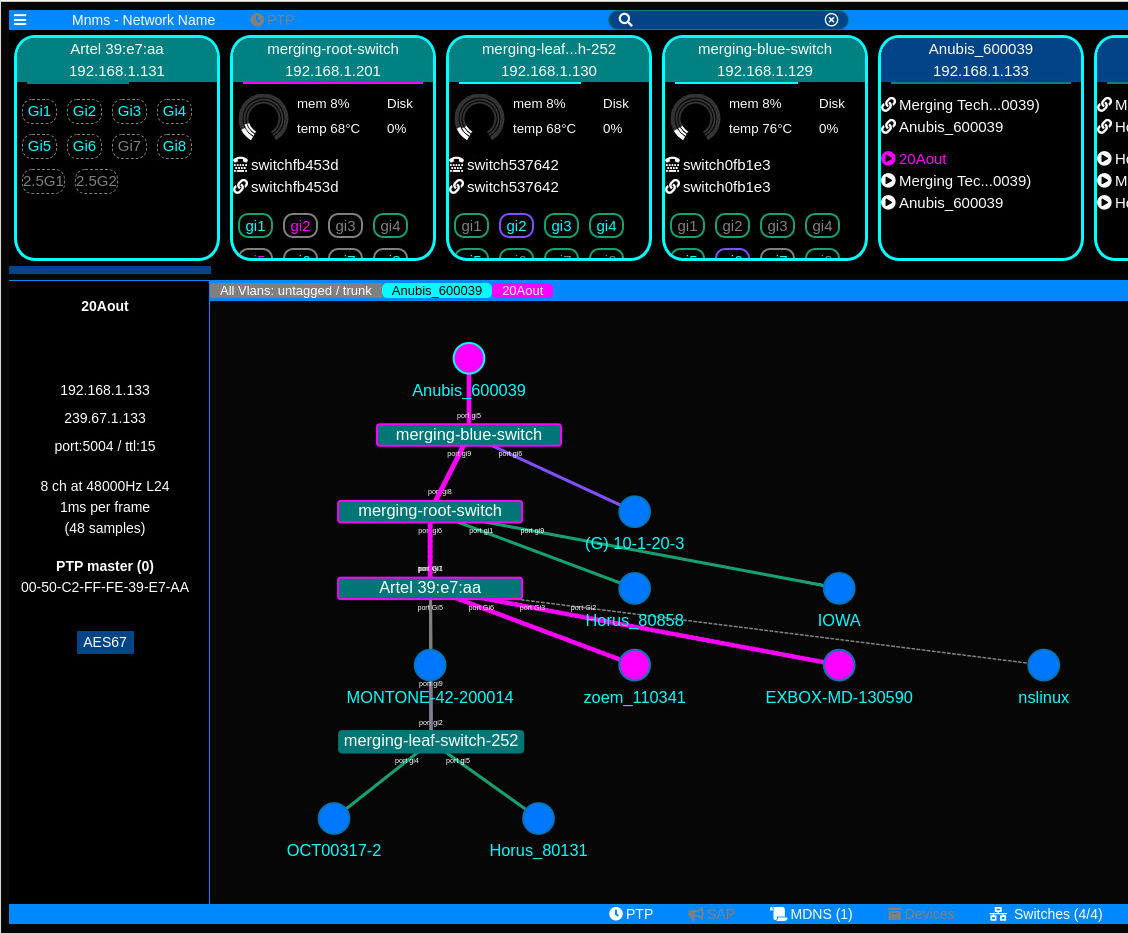
MnMs is a set of tools for real-time monitoring and administration of media networks like ST2110, AES67, Dante, etc. It provides network topology, VLAN information, switch port details, MDNS services, and group registration tracing.
It has seen continuous updates, including the addition of VLAN monitoring, system stats UI, and support for Artel switch.
10. OpenEye
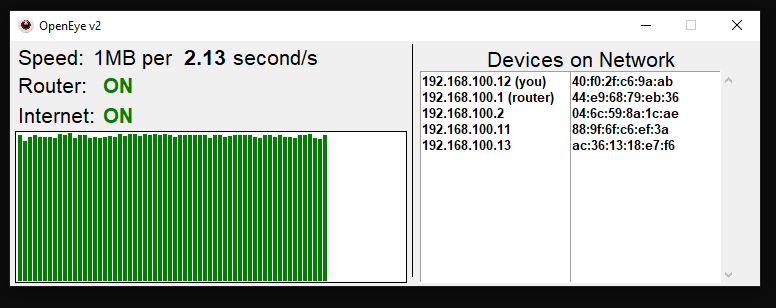
OpenEye is a superior network monitoring tool expertly designed to consistently track your internet speed and vigilantly monitor the devices on your LAN.
11. Network Traffic Analyzer
The Network Traffic Analyzer is a Python script that captures and analyzes network traffic, specifically DNS traffic, using the Scapy library. It offers a user-friendly interface for monitoring network activity and extracting pertinent information from the captured packets.
Features
- Captures network traffic on a specified network interface.
- Filters traffic based on user-defined criteria (e.g., port number, protocol).
- Extracts information from DNS packets, including DNS queries and answers.
- Integrates WHOIS lookup for source and destination IP addresses.
- Saves analyzed traffic data to a CSV file for further analysis.
Read More
