23 Open-source Free Statistical, Data analysis and Notebook Projects for Data Scientists

Note: This article is an Evergreen article. It will receive continues update about the listed applications. You can save it and return to it as a updated resource.
Proprietary data analysis and statistical softwares are expensive, especially for students, but we are fortunate to have open source alternatives which they are competing not just with functionalities but with powerful communities, and educational resources. I have used most of those in the last years on different operating systems (Linux and Mac OSX), alongside with some commercial solutions as well, at the end I have reached a conclusion data science is an open-source centred field where open source is not about saving money but also providing huge open educational opportunity for free.
We have compiled a list for Open source Data portals for OpenData publishing, which helps researchers & organisations.
This list is created to help newcomers, and students to get the most used, popular and powerful data science tools.
1 - RStudio
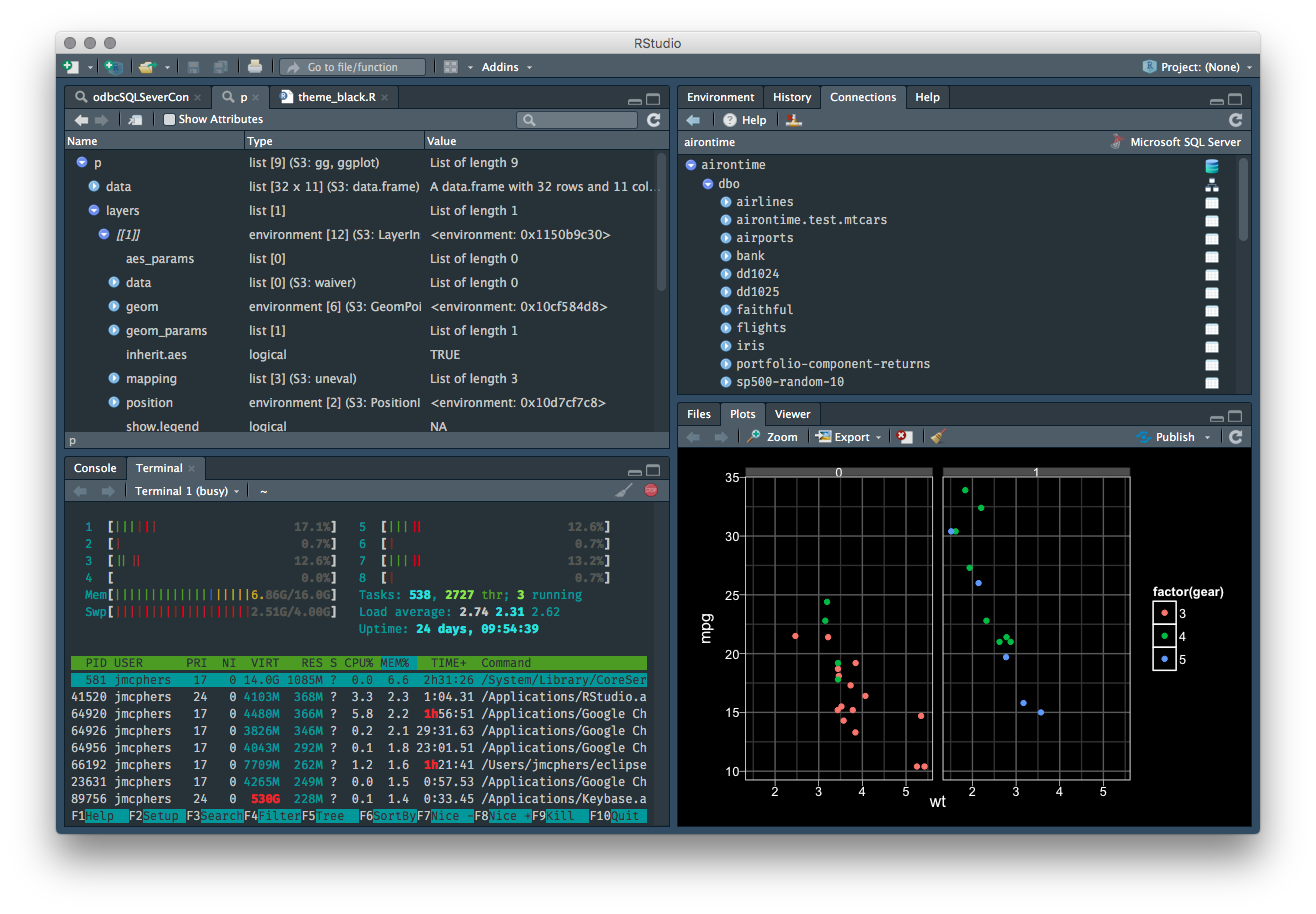
RStudio is the integrated development environment (IDE) for R programming language, It was built to ease and automate the workflow of R with a user-friendly interface. Many people are not comfortable working with terminals, RStudio was built to make R easier for them. It has a built-in package manager, session manager, terminal panel, a history manager, logger, and environment manager, data viewer and of course code editor with syntax highlighting. But I consider the most important features are managing projects and working directories and the interactive debugger.
I have been using RStudio for a long time, on Linux and MacOSX, for several projects, It's quite a productive environment especially for data manipulation, analysis, automated reporting and of course my favorite: data exploration.
2 - Juno IDE : Julia language IDE
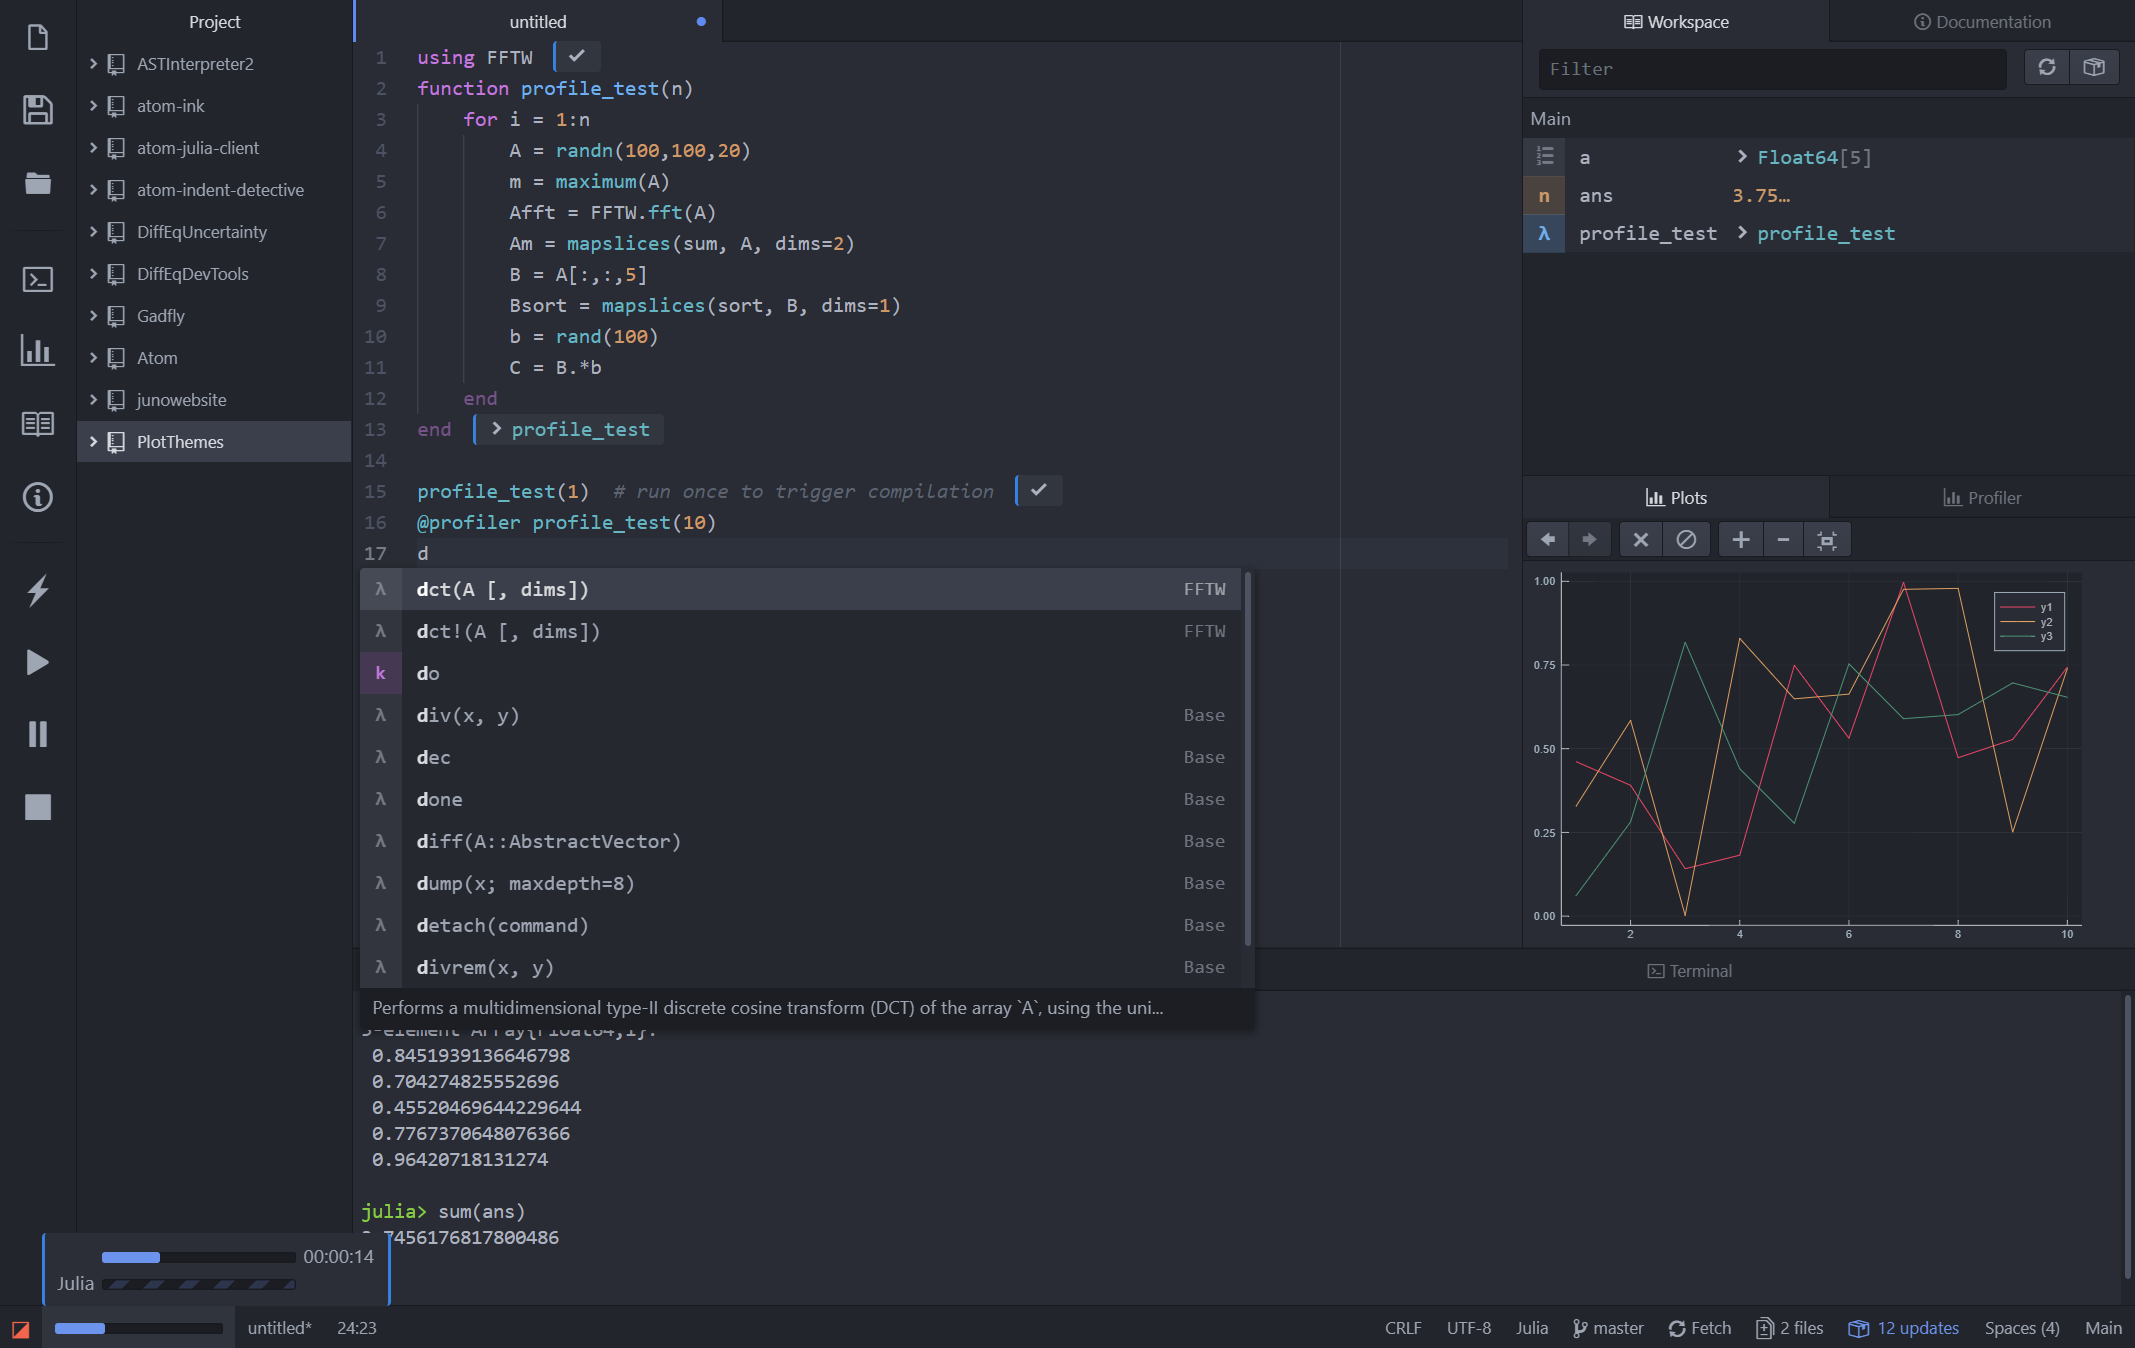
Julia language is an open source general purpose programming language,Though, Julia was built to serve as general-purpose language, It manages to attract data scientist and data engineers for its data-science ready features and friendly feature-rich ecosystem which includes: many options for Data Visualization and Plotting, easy datasets management with interactive real-time options, powerful machine learning packages, and parallel computing features.
Julia language has many data-science ready packages including data manipulation, mathematics, and BigData ready packages. It supports also using packages from Python, R, C/Fortran, C++, and Java.
Juno IDE is RStudio equivalent for Julia programming language. It was built on top of Atom IDE, and featuring multiple views and extending the Atom's default view to compete with RStudio for Julia.
3 - Rodeo: Python IDE for Data science
Rodeo is RStudio equivalent for Python. It was built to provide similar user-interface like RStudio, and similar features including a session manager, console pane, environment manager, graphs manager, GUI package manager, and more.
Rodeo is available for MacOSX, Windows, and Linux.
4 - Jamovi
Jamovi is a free, open-source statistical analysis software with easy to use interface and seamless integration R language integration, with complete spreadsheet management. Jamovi has built-in tools for social science. Jamovi is packed by powerful libraries which are available for free download.
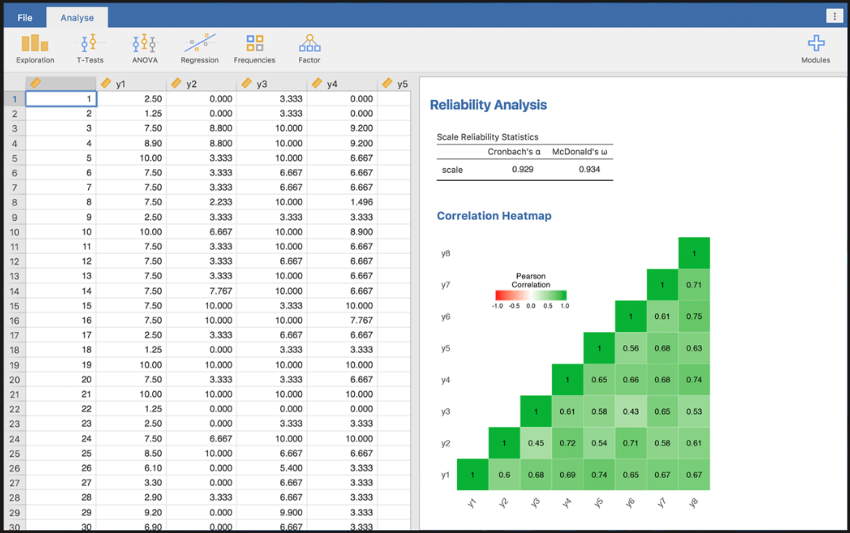
5 - JASP
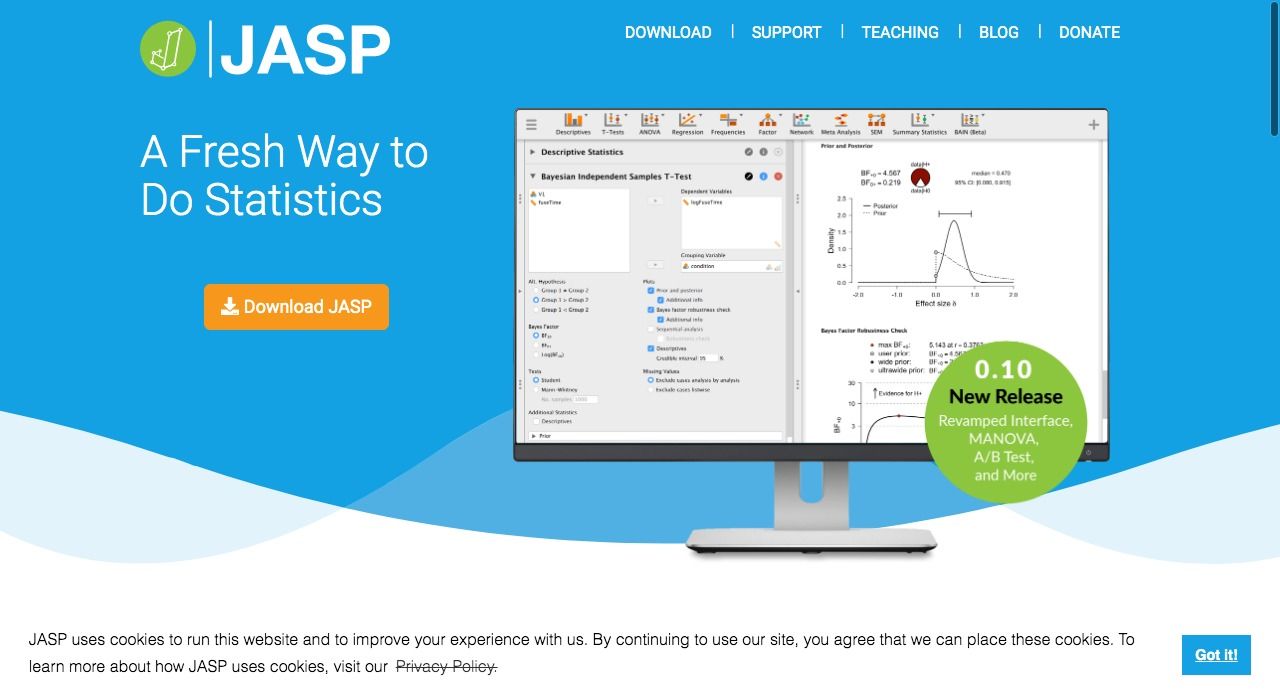
JASP is an easy-to-use statistical analysis software, Its the perfect choice for beginners and students. JASP has installable packages for Windows, MacOSX, and Linux. It can run on the cloud as well using RollApp which is a platform for running the desktop application in the cloud. In addition to JASP format *.jasp, JASP reads multiple data file formats including .sav, .txt, .csv, and .ods.
JASP was released as an open-source project under GPLv3.0 and it's supported by the University of Amsterdam, JASP team has released get started tutorial, while How to use JASP" is full of blog tutorials, videos and GIF images for JASP functionalities.
I would recommend this software to beginners and students.
6 - SOFA Statistics
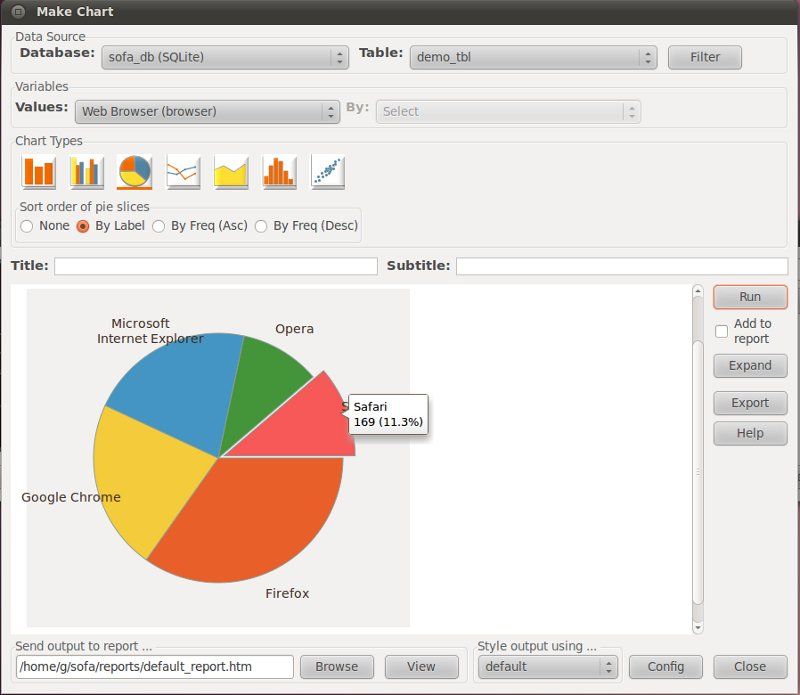
SOFA is a statistical analysis software, it's not related to SOFA Medical Simulation framework we have mentioned in this post. I have reviewed SOFA the first time it was released in my old blog, It was the quite simple alternative back then as simple and easy statistical analysis software. Through the years SOFA statistics has proven to be a solid statistical analysis package.
SOFA connects directly to different database engines, like MySQL, PostgreSQL, SQLite, MS Access, CUBRID and Microsoft SQL Server. It also supports multiple data files formats as tab-separated values (TSV), comma-separated values (CSV), Excel files, OpenOffice Calc and Gnumeric files, and reads the Google spreadsheets online files.
SOFA supports many statistical operations, many chart and graph options, and advanced automated reporting.
SOFA was built using Python, has installation packages for Windows, Mac OSX and Linux ( Ubuntu ). I have used it before with LinuxMint, and it works without issue.
7 - Gretl
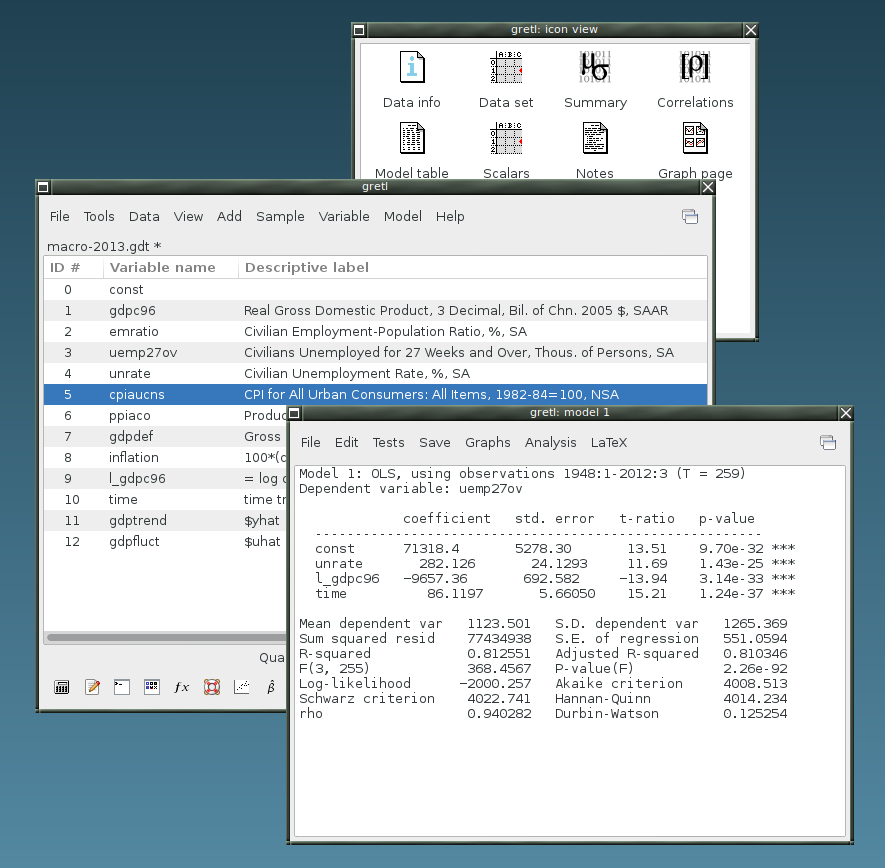
Gretl is a free/ open source user-friendly statistical software for Windows, MacOSX, and Linux. It supports multiple languages including ( Spanish, German, Italian, French, Polish, Russian, Turkish and more).
Gretl has GNU R integration, Integrated powerful scripting language support (hansl), mixed time-series operations, parallel processing, and many econometric analysis operations.
Gretl was written in C, which explains the speed, parallelization, easy seamless data exchange with GNU R, GNU Octave, Python, Ox, and Sata.
Gretl supports many file formats, Excel files, tab-separated values (TSV), comma-separated values (CSV), Gnumeric and Open Document worksheets ( OpenOffice/ LibreOffice files) and SPSS files.
Gretl has packages for Linux distributions ( Debian, Fedora ), Windows and MacOSx.
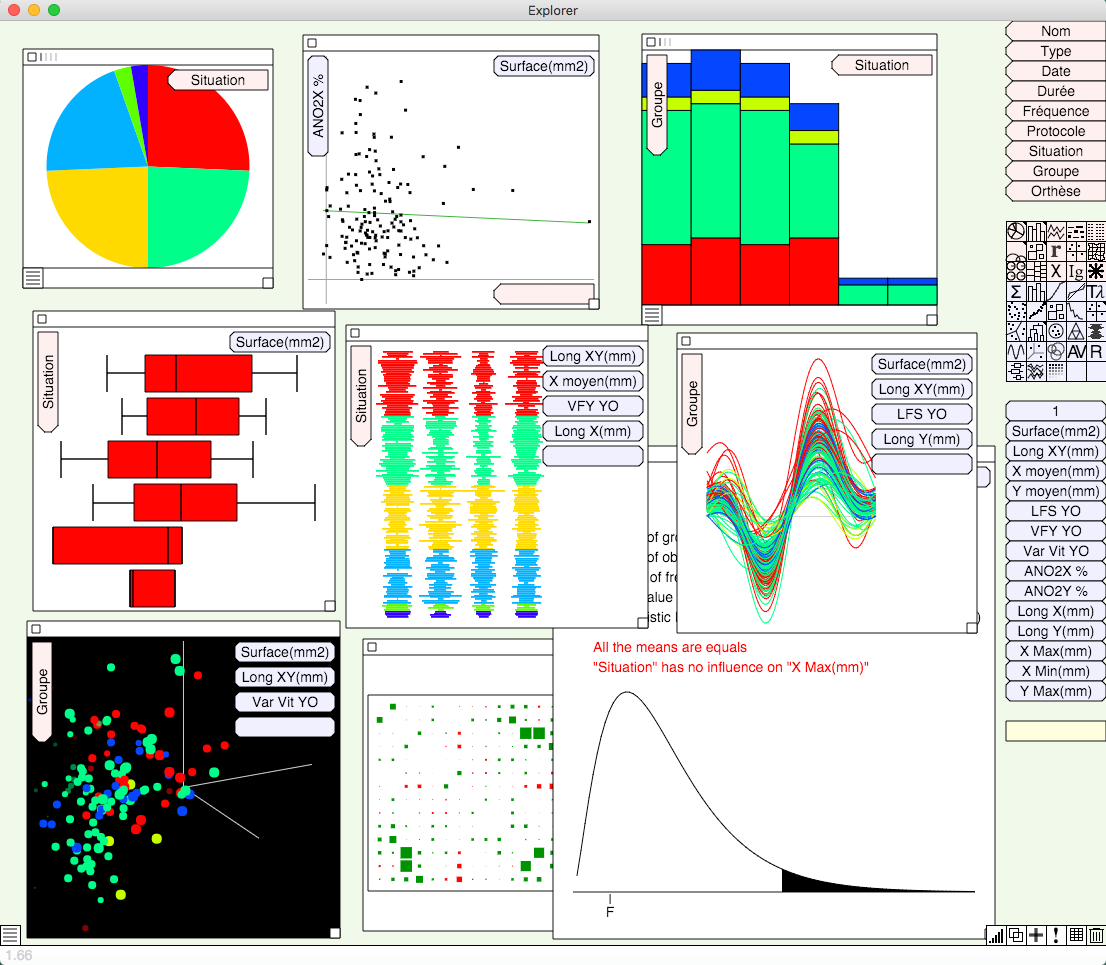
8 - Explorer

Explorer is a small data analysis software, built using javascript on top of Electron, so it runs on Windows, MacOSX, and Linux. It's very easy to use with a simple user-friendly interface with drag-and-drop options to ease data explorations. The project has not updated for 2 years, however, it works
Explorer supports data-text files as .tab, .csv, .json, .dta, and Excel files, Just drag and drop the file into the drop area/ the app and it'll load the file, and prepare the fields for exploration.
Explorer has many video tutorials which demonstrate the ease of using it. Its repository contains sample data files to experiment with.
9 - GNU PSPP: Open source SPSS Alternative
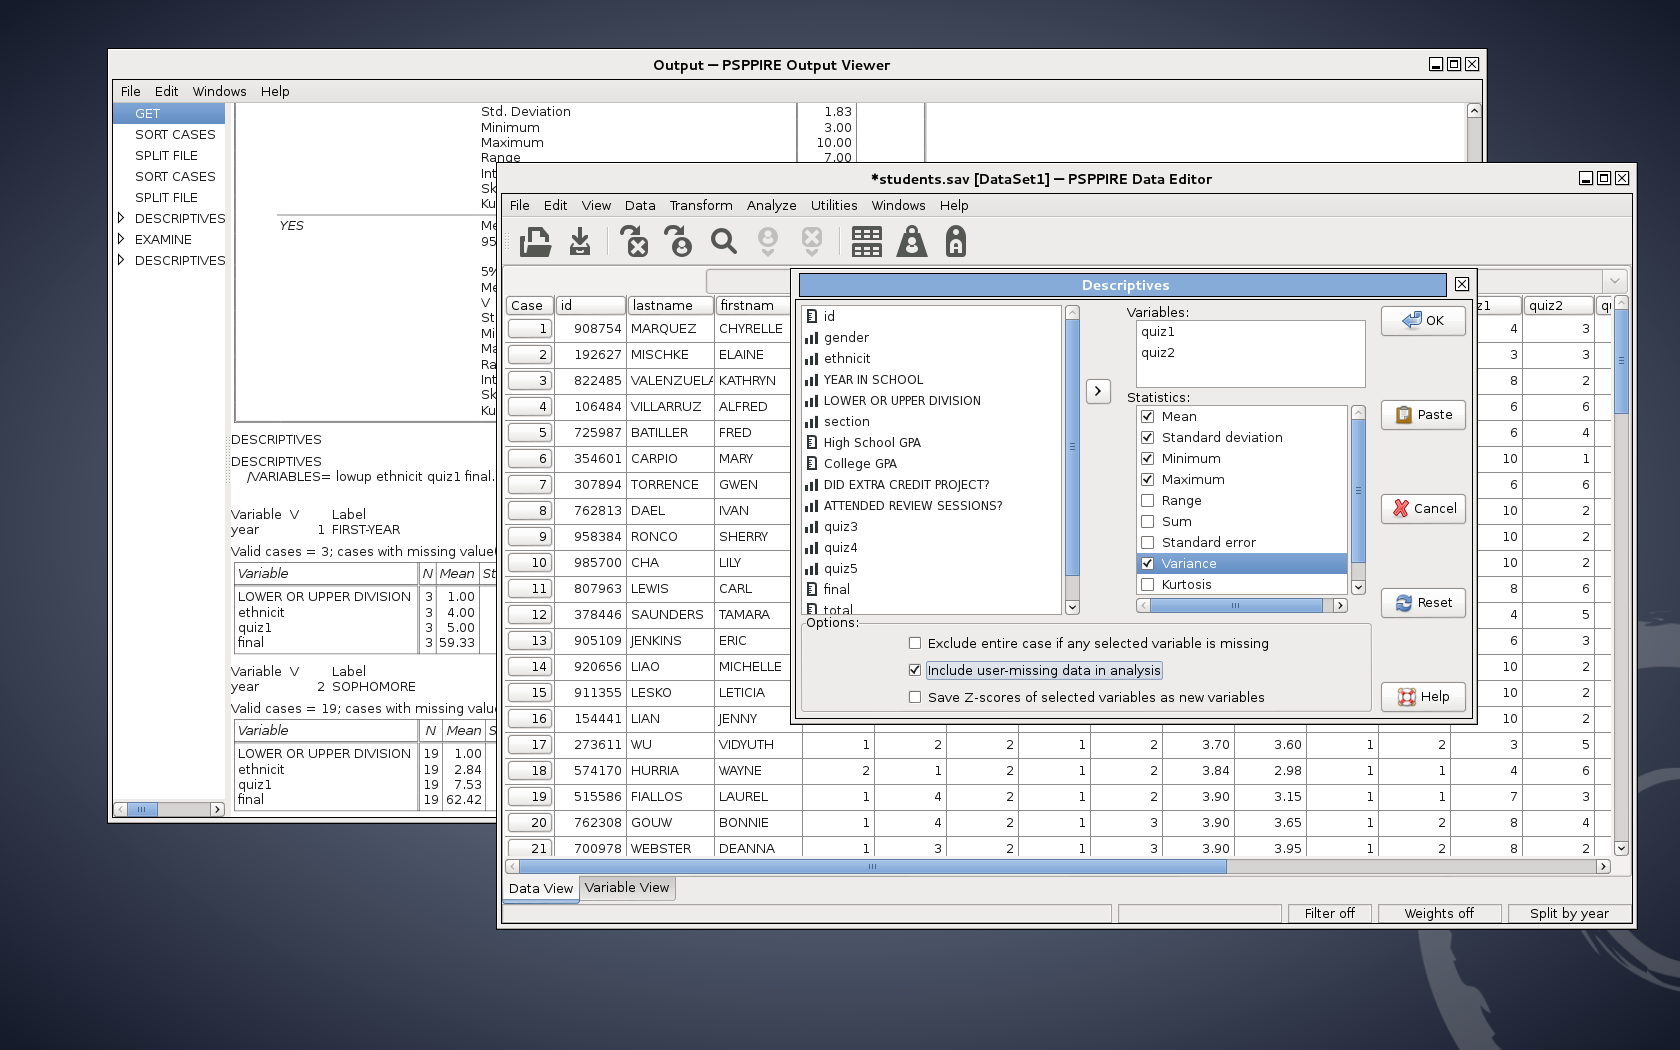
GNU PSPP is an open source alternative for SPSS ( Proprietary Statistical Software), It provides similar functionalities to SPSS with an addition to full support of open source generated and open-data file extensions as Gnumeric, LibreOffice and OpenOffice. It works smoothly with large datasets.
PSPP offers downloads for Windows installer, DMG files for MacOSX, and official installation packages for multiple Linux distributions like Debian, Ubuntu, Fedora, OpenSUSE and Gnewsense, It has also an official port for FreeBSD (Unix).
10 - MacAnova Statistical Analysis and Matrix Algebra
MacAnova is a free, open source, interactive statistical analysis program for Windows, Macintosh, and Linux written by Gary W. Oehlert and Christopher Bingham, both of the School of Statistics, University of Minnesota.
11 - Knime

Knime is features-rich IDE/ analytics platform for data mining/ data analysis, Its the favourite tool for many data scientist and data analyst, not just because it features, but also because it's well-supported, modular with the support of many production-ready extensions and easy to learn and use.
Knime has a visual workflow which makes it the right choice to focus on the problem-solving not on the code. KNIME is easy to integrate with many open-source platforms as R language, Python, Apache Spark (BigData), H2O machine learning, Deep Learning frameworks/ platforms like TensorFlow or CNTK via Keras. It also integrates with Google spreadsheet.
If you are looking for a productive solution with powerful visual workflow for complex operations and Big Data integration, Knime is the best choice.
Knime is an open source software released under GPL, and It's available for free download for Windows, Linux, and MacOSX.
12 - Raw Graphics
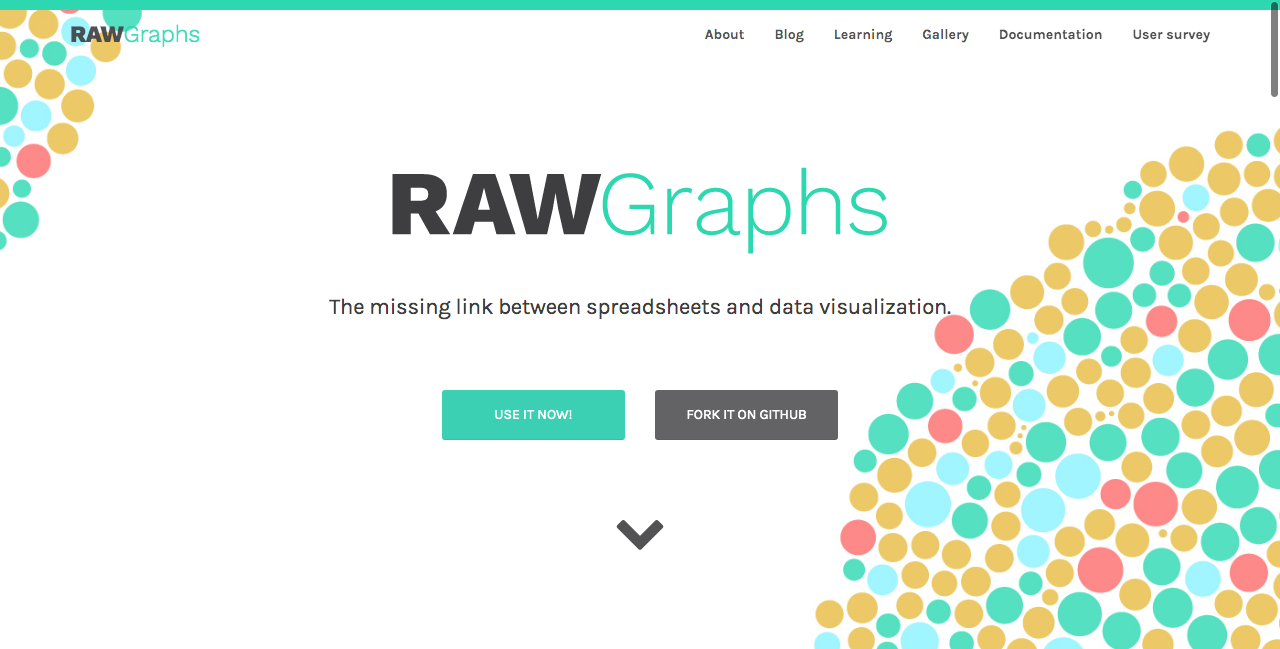
Raw graphics is a free open source for vector-based visualization, It was built with HTML/ JavaScript and D3 graphics library.
RAWGraphs aims at providing a missing link between spreadsheet applications (e.g. Microsoft Excel, Apple Numbers, Google Docs, OpenRefine, …) and vector graphics editors (e.g. Adobe Illustrator, Inkscape, …).
13 - Scilab
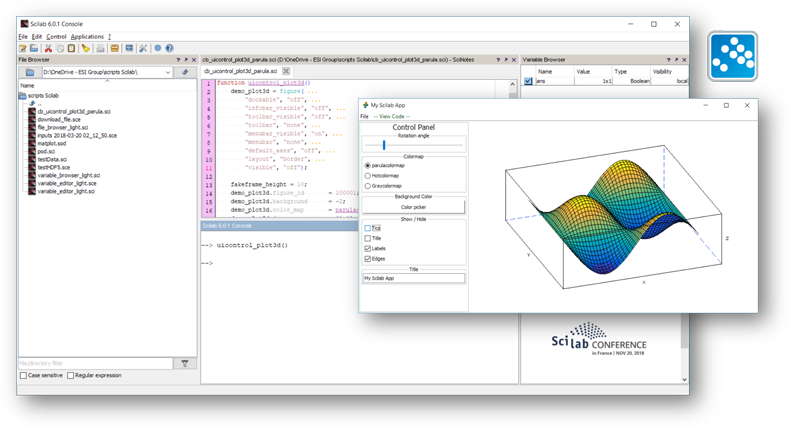
Scilab is an open-source free software for engineers and scientists, Though, it was built to support multiple engineering fields as mechanics, thermodynamics and electronics, It has powerful mathematical functions (+1,700 mathematical), descriptive statistics, Probability distributions, Linear and nonlinear modeling, Probability distributions, Machine learning, supervised learning , data analysis features with seamless data visualization and animated visualization support. Scilab has built for dynamic systems modeler and simulator with real-time support.
Scilab has cloud support with cloud API for developers, and rich tutorial set and documentation.
14 - Visual Stats
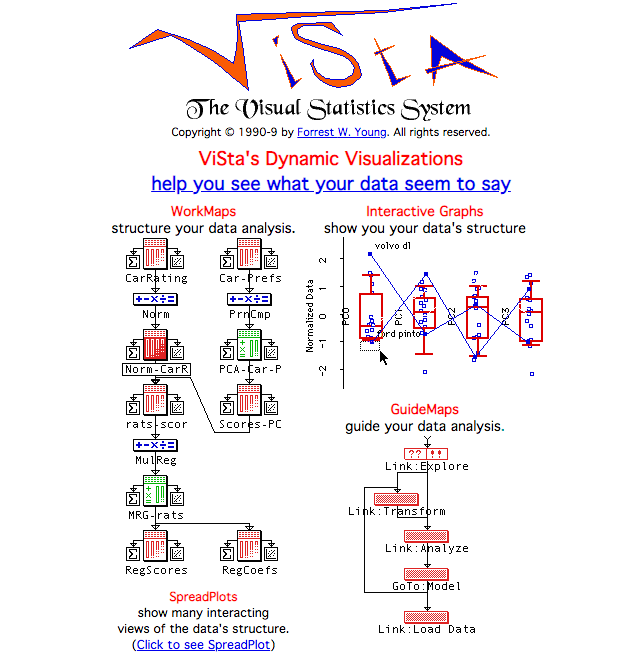
Visual Stats is a lightweight free statistical analysis package, It has not been updated or have enough documentation. The old version has installable packages for Windows, MacOSX, and Linux. ViSta was written in Lisp, FORTRAN and C. Visual Stats ( ViSta ) introduced visual stats methods alongside ViDAL : ViSta's Data Analysis Language for writing applets, scripts, and data programs.
It's a powerful package, however, it's difficult to install and manage.
15- Tanagra
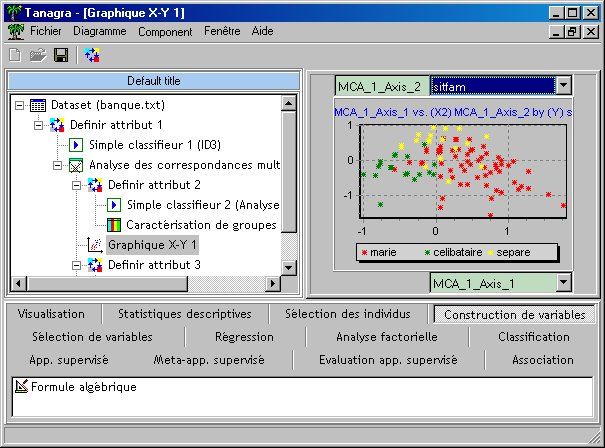
Tanagra is an old software for data mining built for academic and research purposes. It has exploratory data analysis options, statistical learning, and machine learning support.
Tanagra is an open source software, Though it was not updated for years it worth mention in this list considering its lightweight and rich features.
16 - OpenEpi: Open source Statistical analysis for Epidemiology & Biostatistics
OpenEpi, is an open-source statistical analysis package dedicated to epidemiological statistics for public health and biostatistics.
OpenEpi was written using web technologies ( Javascript/ HTML ).
17 - SageMath
SageMath is an open source mathematics software, built using varies mathematical and analytics open source package, as NumPy, SciPy,ٍ Sympy, and more. SageMath is available for Windows, Linux, MacOSX. It was released under GPL. SageMath has a comprehensive library for its users including end-user rich documentation, and an impressive list of publications citing SageMath.
The notebooks
18- Jupyter:
Jupyter is a data-science friendly programming notebook, It allows the user to create a notebook with live code, dynamic graphs with sets of data manipulation/ transformation tools, statistical functions, and multiple integration options.
Jupyter supports +40 programming languages including R, Python, Julia, Scala, Lua, C, C++, JavaScript, Erlang, Ruby, Java and more. It supports integration with Apache Spark and TensorFlow. Jupyter outputs HTML, images, Videos, LaTeX, and many other options for the user to choose from.
Jupyter is the favourite notebook for data scientists as it supports many kernels, with an easy learning curve, many deployment options, and cloud support. It can be installed using Anaconda or as a Python package using Python’s package manager ( pip ).
19 - BeakerX Notebook
BeakerX is a collection of extensions and kernels to Jupyter notebook, It comes with support for Java/ JVM support,Groovy, Scala, Clojure, Kotlin, and with complete Apache spark integration and seamless configuration using GUI widget and Spark cluster support.
BeakerX has many features to generate powerful interactive results as interactive data tables widget that supports sorting, filtering, formatting, Interactive plotting with time-series support, real-time options, in addition to the standard plotting options like histograms, scatter plots, Beakers plotting has heatmaps, and treemaps support as well.
BeakerX can be installed using Anaconda, The package manager for data science, which can be used to install Jupyter as well. Anaconda is easily available to install on Windows, MacOSX, and Linux, and It has 1,500+ data science for R and Python.
20 - Apache Zeppelin
Apache Zeppelin is an open source project aiming to provide Multi-purpose Notebook data analytics notebook platform which features multiple data sources, multiple languages like R, Python, Scala, SQL, and more. It's the best choice for Big Data as it supports Apache Spark and Apache Hive.
21 - Kajero
Kajero is a free open-source interactive Javascript notebook solution for data scientists. Kajero uses plain markdown, which makes the note easy to share on Github as Gists. It has many options for graphs as it uses D3, NVD3, and Jutsu. It supports different data sources and reshaping of the data structure using an open source library ( reshaper ) to achieve that.
22- Iodideα
Iodidea is a free web-based platform, that utilizes web technologies like javascript, markdown, and WebGL into an interactive social notebook for data scientists. It's easy to use, learn and well documented. It has developer-friendly API and modular ecosystem for plugins as other programming languages plugins support like Lua, Ruby, Julia, OCaml, Python, and Assembly.
Iodideα uses JSMD which is short for JavaScript MarkDown, it's very easy to learn and use.
The social features of this project make it easy to create, share, and collaborate for teams and groups, with the tools they already know as mentioned on the project's website. This project is backed by Mozilla.
23 - µCalc
µCalc is a browser-based math web solution. It features multiple users on simple UI with interactive features. Though the project is discontinued, Its still begin downloaded and used by many users around the world.
µCalc was built using Javascript/ NodeJS with Math.js library, after a quick look into the code, the project requires a full rewrite to make it more Nodejs ecosystem friendly.