Orange is an Open-source Self-hosted Toolbox for Data Mining

Orange is a powerful and user-friendly data mining and visualization toolbox designed for both beginners and experienced users. With Orange, you can easily explore and analyze your data without the need for any programming skills or advanced mathematical knowledge.
The primary goal of Orange is to make data science accessible to everyone, regardless of their technical background. By providing a workflow-based approach, Orange simplifies the complexity of data analysis, allowing users to focus on the intuitive concepts and insights hidden within their data.
Whether you are a data owner looking to gain valuable insights or simply curious about exploring data, Orange provides you with the tools and resources to accomplish your goals effectively and efficiently.
Feaures
- Data Preprocessing: Orange provides various data preprocessing techniques, such as data cleaning, feature selection, and data transformation. Users can handle missing values, remove outliers, and normalize data to prepare it for further analysis.
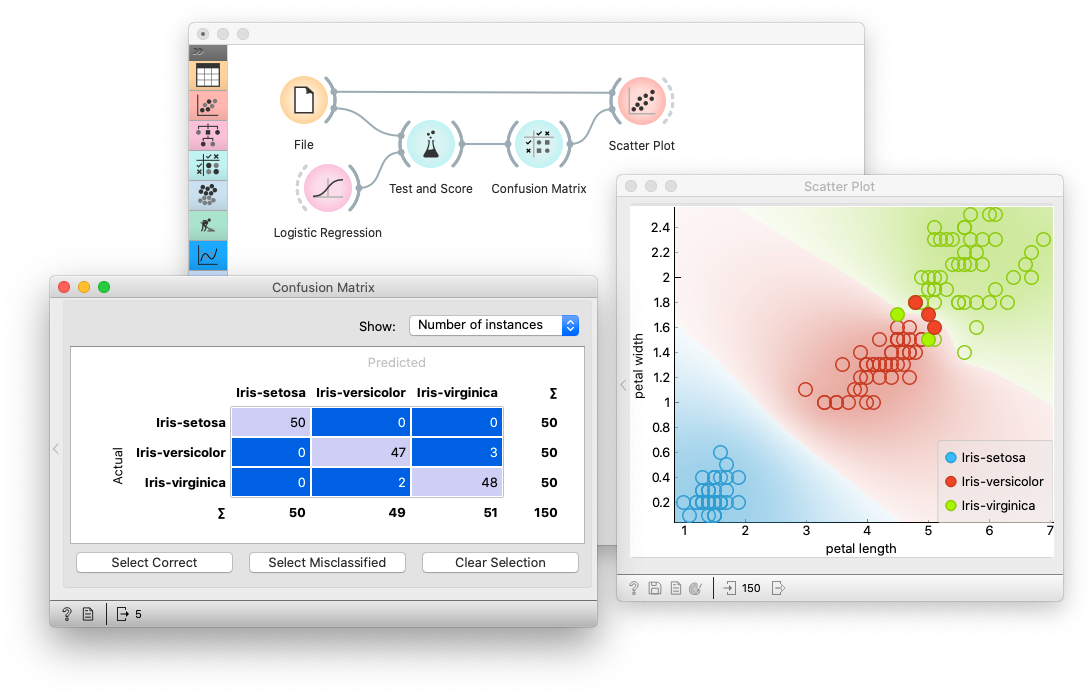
- Exploratory Data Analysis: Orange offers interactive visualization tools that allow users to explore their data visually. Users can create scatter plots, bar charts, histograms, and other visualizations to gain insights into their data and identify patterns or relationships.
- Machine Learning: Orange provides a rich set of machine learning algorithms for classification, regression, clustering, and association rule mining. Users can easily build predictive models by selecting algorithms, configuring parameters, and evaluating their performance.
- Feature Engineering: Orange enables users to create new features from existing ones using various transformation and combination techniques. Users can generate polynomial features, discretize continuous variables, and create interaction terms to enhance the predictive power of their models.
- Model Evaluation and Validation: Orange offers comprehensive model evaluation and validation tools. Users can assess the performance of their models using various metrics, such as accuracy, precision, recall, and F1 score. Orange also supports cross-validation and train-test splits to estimate model performance.
These are just a few of the many features that Orange provides. With its user-friendly interface and extensive functionality, Orange is a versatile tool for data mining and analysis.
License
Copyright (c) 2016 Bioinformatics Laboratory, University of Ljubljana,
  Faculty of Computer and Information Science

All rights reserved.

THIS SOFTWARE IS PROVIDED "AS IS", WITHOUT ANY WARRANTY WHATSOEVER.

If you use or redistribute this software, you are permitted to do so
under the terms of GNU [GPL-3.0]+ license.
Resources
 biolab
 Bioinformatics Laboratory, University of Ljubljana