10 Best Free Self-Hosted Server Monitoring Tools for Web Developers, Freelancers, and Agencies


Table of Content
If you are web developers, freelancers, or web agencies, you have likely deployed many websites and apps for your clients that include open-source web apps for project management, file sharing, and other productivity tools for your team.
Let's say you have around 1-10 web apps running on your systems or for your customers. How can you monitor these apps?
 Hazem Abbas
 Hazem Abbas
Here, we provide the best open-source alternatives.
1- Performa
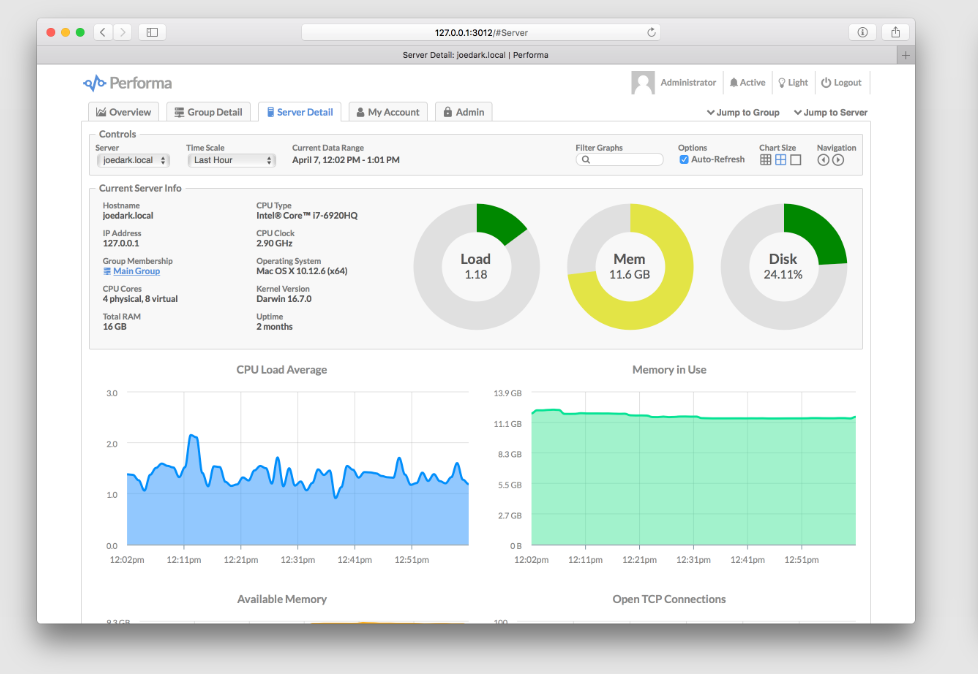
Performa is a user-friendly multi-server monitoring system with a web-based interface. It allows you to track essential metrics like CPU usage, memory, disk space, and network activity, along with your custom metrics.
You can set up alerts based on specific conditions, receiving notifications via email or webhooks. Plus, you have the option to store timeline data either locally or in Amazon S3 for easy access.
Features
- Easy to install, configure, and operate
- Monitor any number of servers with automatic addition of new servers
- Manual or automatic assignment of servers to groups
- Supports ephemeral servers, including serverless and autoscaling environments
- Collects metrics every minute for accurate monitoring
- Multiple graph scales available: hourly, daily, monthly, and yearly
- Real-time views with auto-refreshing graphs for immediate insights
- View individual server graphs or aggregate data for entire groups
- Add custom commands to graph your own metrics
- Configure alerts with custom trigger expressions
- Receive notifications via alert emails and webhooks
- Snooze feature available to silence notifications
- Snapshot feature provides additional details about servers
- One-click snapshot-to-URL-to-clipboard functionality for easy graph sharing
- Graph data retention options: indefinite storage or auto-expiration
- Light and dark themes available for user interface customization
Hazem Abbas
2- Netdata
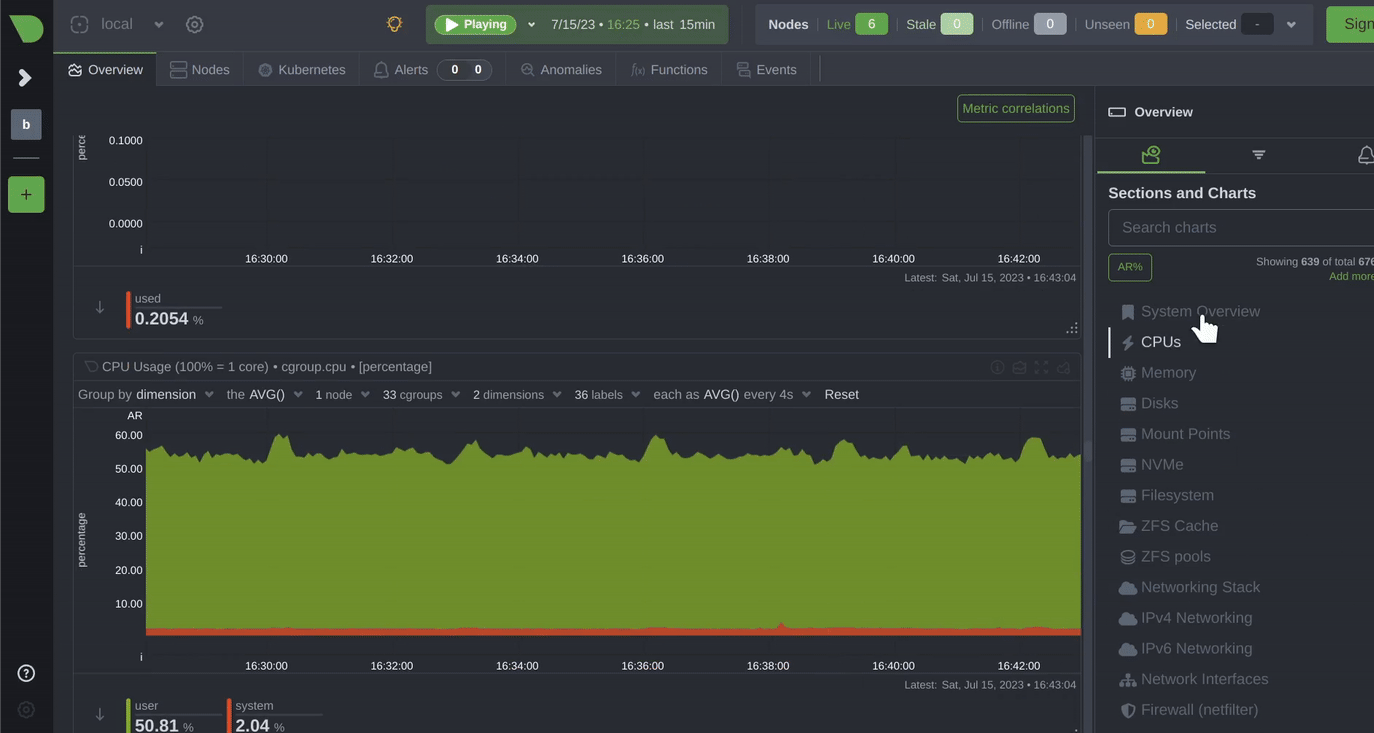
Netdata is a free high-performance observability platform for monitoring metrics and logs in real-time, designed for both cloud-native and on-premises environments. It offers zero-configuration setup and features a distributed architecture that processes data at the edge, eliminating the need for central databases.
With A.I. insights and automated anomaly detection, users can efficiently troubleshoot issues and analyze data. Its modular design allows for easy construction of observability pipelines, providing a comprehensive monitoring experience for systems, containers, and applications.
Netdata Features
- Data Collection: Monitors over 800 integrations, including operating systems, containers, virtual machines, hardware sensors, applications, and logs.
- Real-Time Monitoring: Provides low-latency, high-resolution data collection with a 1-second delay from collection to visualization.
- AI-Powered Anomaly Detection: Utilizes machine learning models at the edge for automated anomaly detection based on historical behavior.
- Log Management: Converts plain text logs into structured systemd-journald entries, enabling powerful log visualization directly at the edge.
- Observability Pipelines: Allows linking of multiple Netdata Agents to create centralized observability points for data replication and retention management.
- Automated Visualization: Features automated dashboards using the NIDL data model for intuitive data exploration and visualization.
- Out-of-the-Box Alerts: Comes pre-configured with hundreds of alerts for common issues, with various notification methods available.
- Low Maintenance: Offers automated dashboards, alerts, and zero-touch machine learning for easy scalability and high availability.
- Open and Extensible: A modular platform that supports integrations with other monitoring solutions and can be extended as needed.
- User-Friendly UI: Features a user interface for data visualization and configuration, included in the Netdata ecosystem.
Hazem Abbas
3- eZ Server Monitor
eZ Server Monitor is a lightweight web-based dashboard for Linux systems, designed to provide essential system information in a simple interface.
It is written as a PHP script, it displays critical metrics, including hostname, operating system, kernel version, uptime, last boot date, current user count, and server date and time.
Moreover, it features gauges that show CPU load averages over one, five, and fifteen minutes. While the project is older and has not been updated for some time, it remains functional; however, users should exercise caution when deploying it.
Hazem Abbas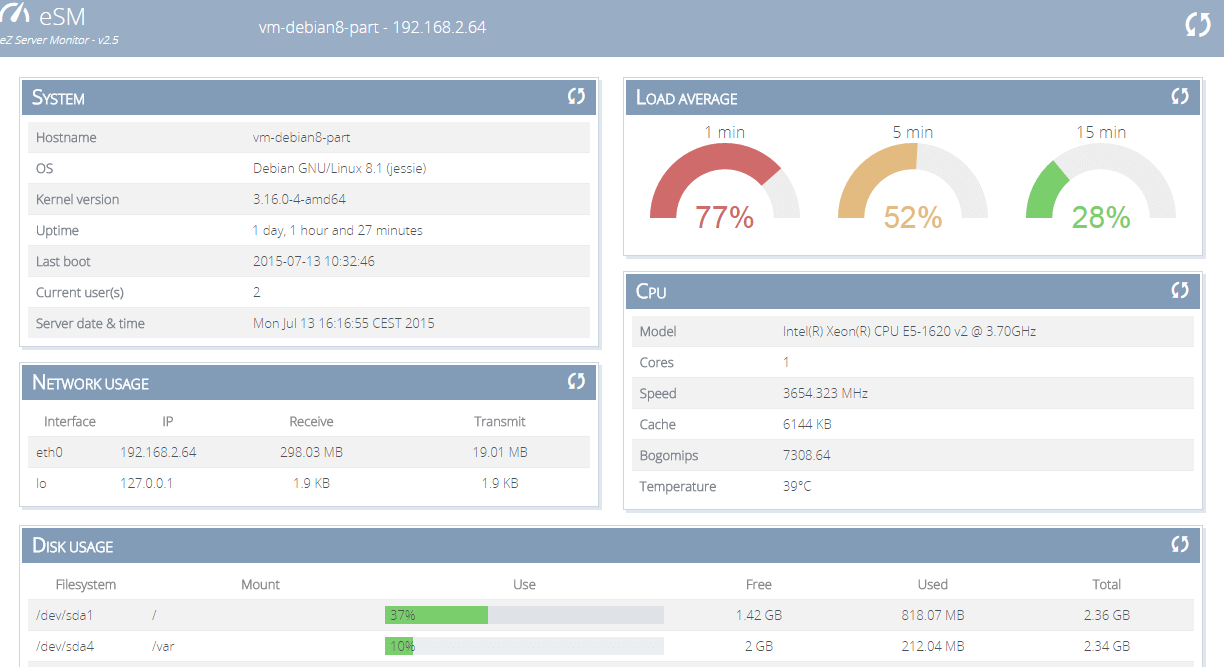
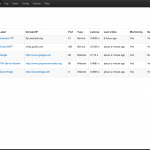
4- PHP Server Monitor
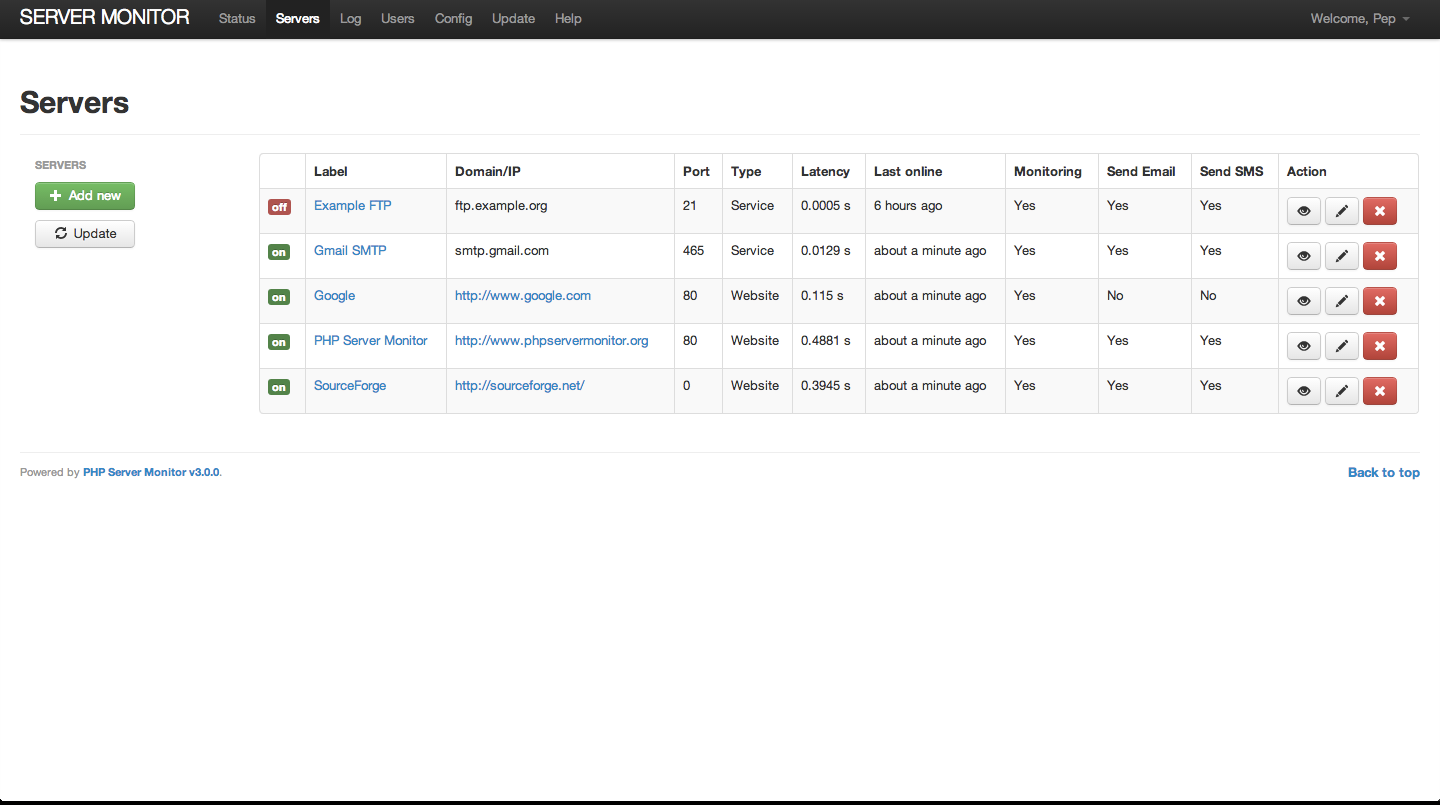
PHP Server Monitor is a PHP script that checks the status of your websites and servers. It features a web-based interface for managing your services and websites. You can also manage users for each server, including their mobile numbers and email addresses.
Features
- Service Monitoring: Checks if specific services on your machine are running by connecting to an IP or domain on a specified port (e.g., IMAP on port 143).
- Website Monitoring: Uses cURL to open a website and check the HTTP status code; identifies errors based on 4xx/5xx codes.
- Content Checking: Allows setting a regular expression to match content on a webpage; if no matches are found, the website is considered down.
- Notification Options: Supports notifications via email, SMS, Discord, Pushover, Telegram, and Jabber.
- History Graphs: Provides visual graphs of uptime and latency history.
- User Authentication: Features two levels of user access—administrator and regular user.
- Connection Logs: Keeps logs of connection errors, outgoing emails, and text messages.
- Automated Checks: Simple cronjob implementation for automatic server checks.
- Custom Notification Settings: Each server can have its own notification preferences and settings, including available SMS gateways.
5- Uptime Kuma
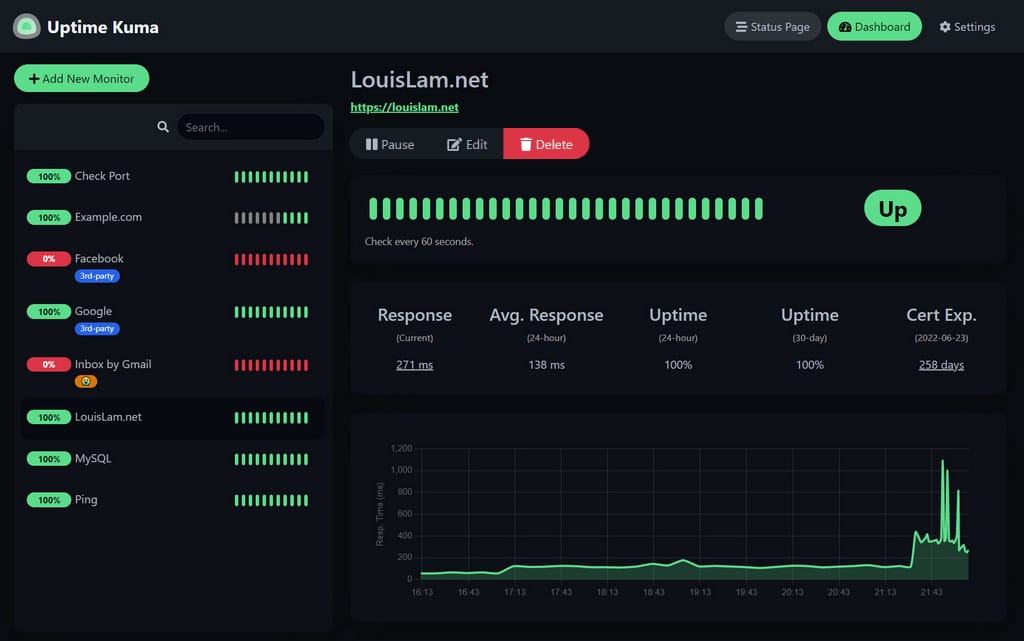
Uptime Kuma is a free powerful and user-friendly self-hosted status monitoring solution designed to keep track of your websites and services.
With its sleek web interface, Uptime Kuma allows you to easily monitor the uptime and performance of your systems in real time. It supports various protocols, including HTTP(s), TCP, and ICMP ping, ensuring comprehensive coverage of your services.
Features
- Monitoring uptime for HTTP(s) / TCP / HTTP(s) Keyword / HTTP(s) Json Query / Ping / DNS Record / Push / Steam Game Server / Docker Containers
- Fancy, Reactive, Fast UI/UX
- Notifications via Telegram, Discord, Gotify, Slack, Pushover, Email (SMTP), and 90+ notification services, click here for the full list
- 20-second intervals
- Multi Languages
- Multiple status pages
- Map status pages to specific domains
- Ping chart
- Certificate info
- Proxy support
- 2FA support
6- SimpleSysMon
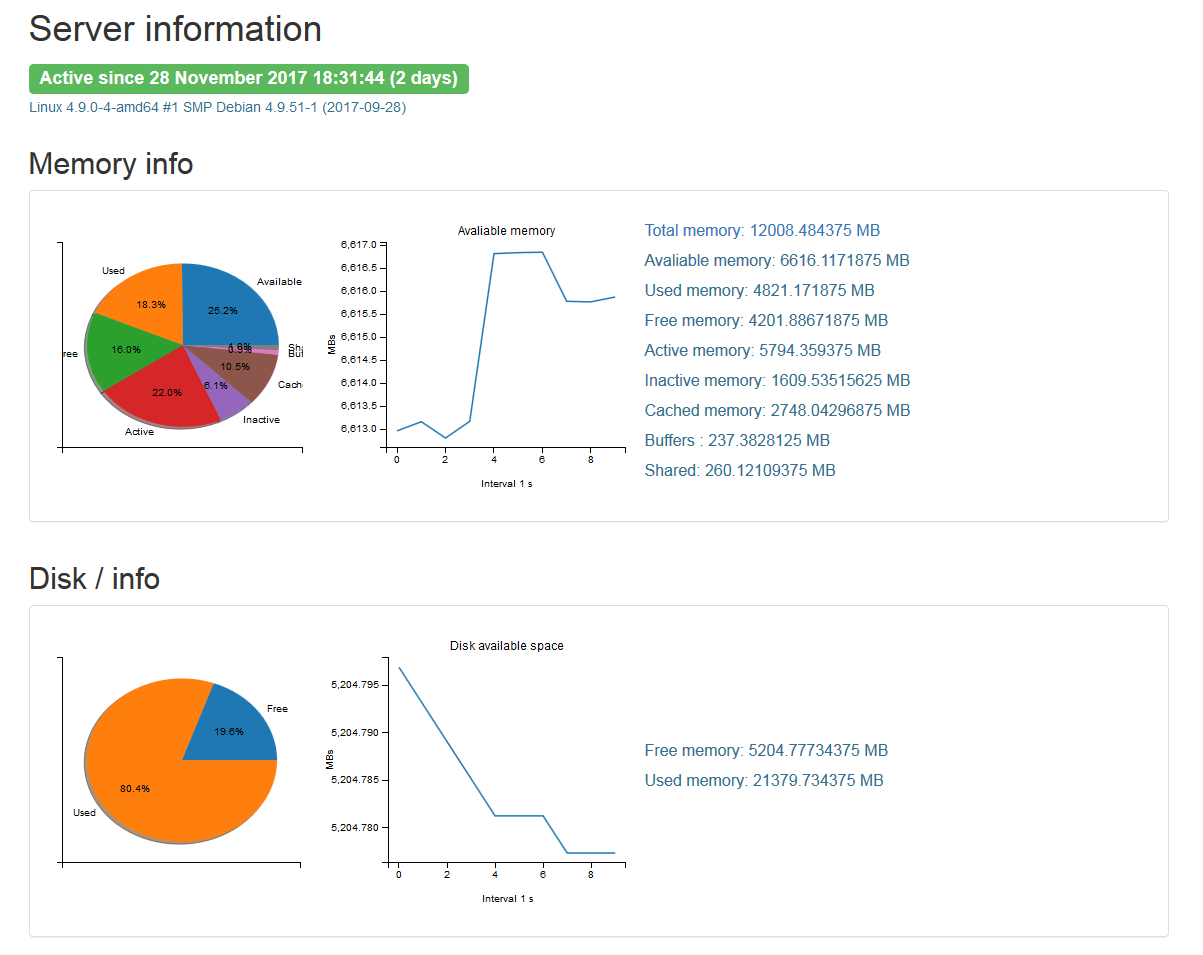
SimpleSysMon is a versatile system monitoring tool designed for both Windows and Linux platforms.
With its straightforward interface, it allows users to easily track essential server metrics.
While it currently provides basic information about memory usage and disk status, SimpleSysMon is highly customizable, enabling you to add your own modules for tailored monitoring solutions.
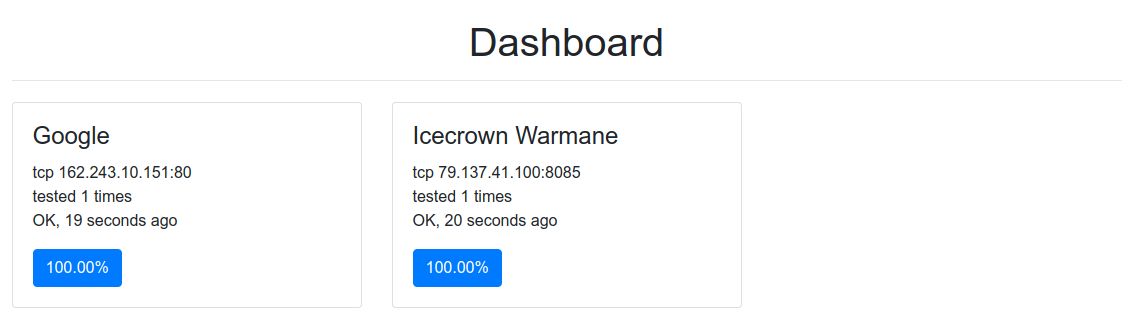
7- Statping - Status Page & Monitoring Server
Statping is a user-friendly web and app status monitoring tool designed for various projects, allowing you to effortlessly create and manage a status page for your websites and applications.
With features that automatically fetch application data, Statping helps you generate a beautiful status page, ensuring transparency for your users.
Built in Go language, Statping is lightweight and requires no additional installations, making it easy to run on multiple operating systems, including Linux, macOS, and Windows.
Its Docker image is a mere ~16MB, ensuring minimal impact on your storage. You can also deploy Statping on a Raspberry Pi.
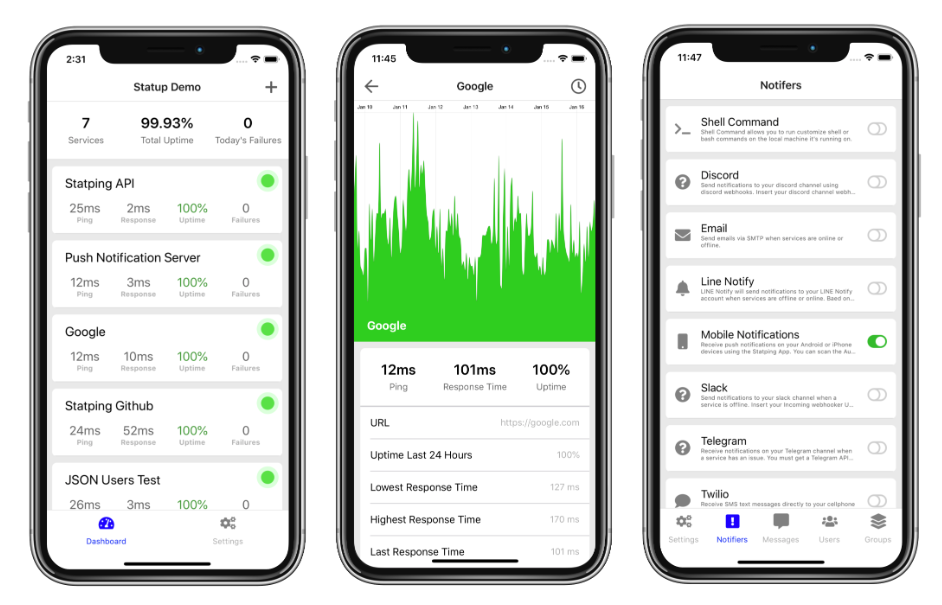
The Statping mobile app enhances accessibility, enabling users to monitor services, receive notifications for service outages, and manage various settings directly from their devices.
With Statping, you can keep your users informed and ensure your status page remains online, even if your server experiences downtime. Explore more on Statping's website.
8- Gossm
Gossm is a server status monitoring tool developed in Go. It periodically checks the accessibility of servers at specified intervals and sends notifications if a server becomes unreachable.
It comes with a simple web interface, users can easily monitor their servers through a dashboard.
Gossm is designed for ease of use, allowing for quick setup and operation. To get started, users can build and run the application with a straightforward command-line interface, requiring only a single binary installation.
Gossm is an effective solution for anyone looking to keep track of server availability with minimal effort.
Gossm Features
- Web App Interface: Offers a user-friendly dashboard for monitoring server status.
- Command-Line Interface (CLI): Supports various command-line arguments for configuration and logging.
- Responsive Design: Adapts well to different devices for easy monitoring on the go.
- Simple and Easy to Use: Intuitive setup and operation for users of all skill levels.
- Single Binary Installation: Simplifies deployment with no need for complex installations.
- Custom Configuration: Allows users to specify custom configuration files for monitoring settings.
- Log Filtering: Users can filter logs for specific text, enhancing the monitoring experience.
- Docker Support: Includes an example Dockerfile for containerized deployment.
9- HotHost
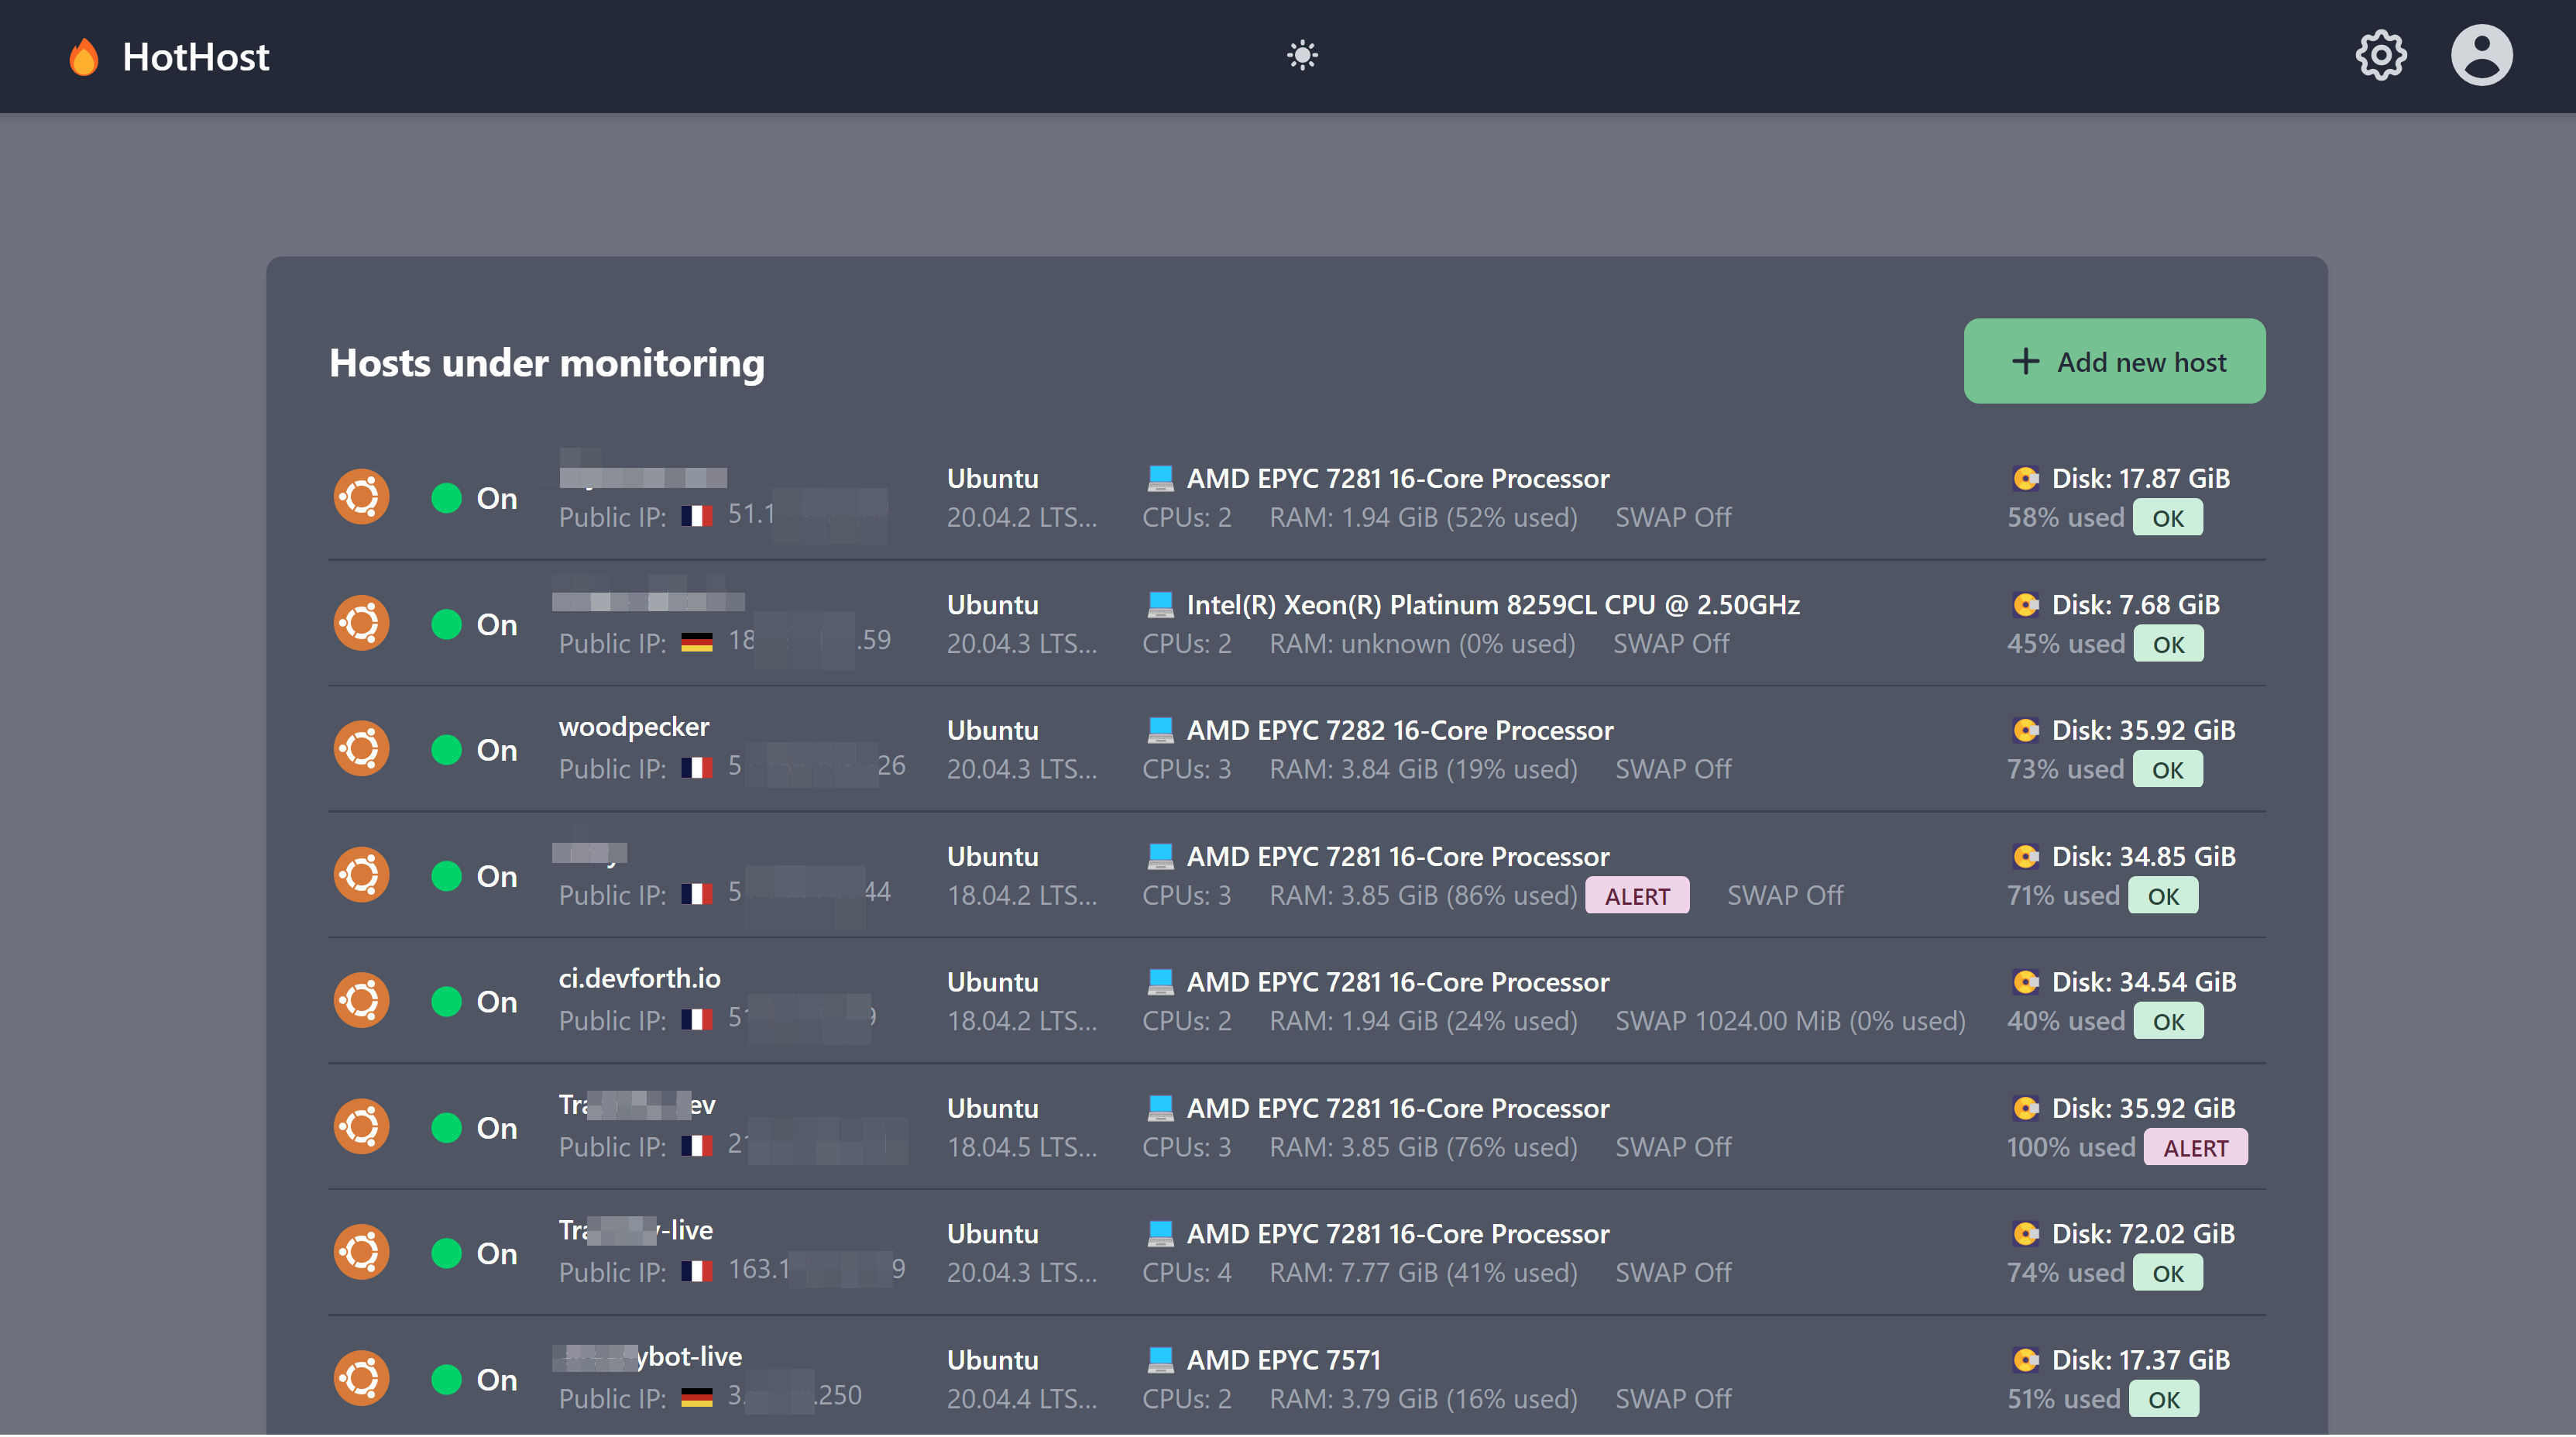
Hothost is a lightweight, open-source server and HTTP monitor that displays disk space and RAM usage percentages.
It alerts users when these thresholds exceed 90%, ensuring efficient resource management and prompt notifications for server performance issues.
- 💾 Shows used disk space percentage and ALERT badge if it exceeds configurable threshold (90% by default)
- 🧠 Shows used RAM percentage and ALERT badge if it exceeds configurable threshold (90% by default)
- ☎️ Built-in plugins to setup free Email/Slack/Telegram notifications
- 🪧 Agents installed using simple code snippets. Options: Docker/Compose/Bash+curl+crontab.
- 🏙 Allows to monitor as many hosts as needed
- ⏰️ Configurable monitoring interval
- 📈 View top 10 processes consuming RAM, historically over last 2 days.
- 🌐 HTTP / HTTPS Monitor, status code check, webpage keywords existence, basic auth, notifications
- 🔒 HTTPS SSL check with expiration reminder (default is 14 days prior to expire, configurable)
- Per hose you can see: OS version, CPU model, RAM size and current RAM usage.
10- API Monitor
API Monitor is a CLI program that help you check your endpoints by requesting the given servers and send a report message in any supported channel (Telegram).
Features
- Check API endpoints status.
- Save the endpoints in sqlite database.
- Provide a bin command so you can execute via terminal or schedule the execution in crontab.
- Send a report message to the supported channels (Telegram).