JASP: A Less Complicated Free Open-source SPSS Alternative for Advanced Statistics
Some time ago, We published an article listing all available open-source free SPSS alternatives, today we will focus on one of that list's lead "JASP".

I had a run with many open-source statistics software and packages, but JASP was truly unique among them.
JASP is a free open-source complete statistical package supported by University of Amsterdam. It's a multi-platform program that runs on Windows, Linux and macOS.
It's designed for users who want to do some statistical work without having to deal with programming or dive deep in learning complex statistical programs. It's a recommended option for students and researchers.
Key Features

- Complete Open-source solution
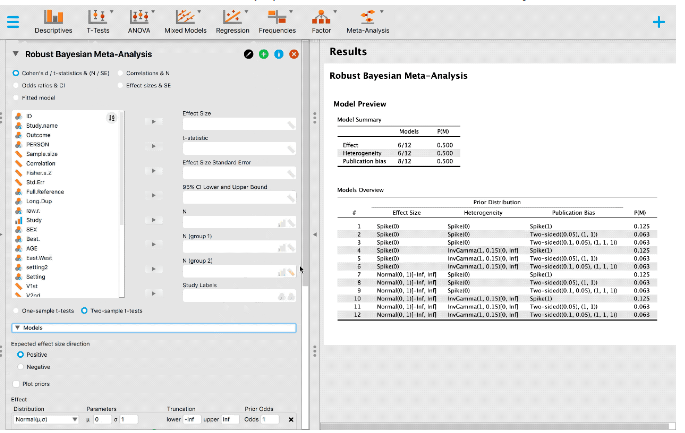
- Simple unique yet a rich interface
- Frequentist analyses
- Bayesian analyses
- Real-time updates for results
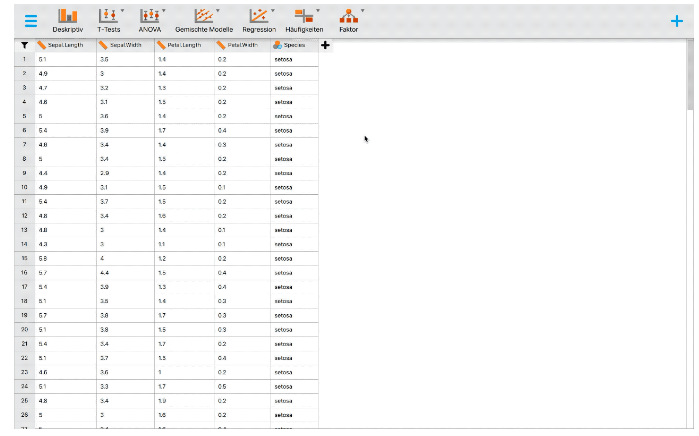
- Spreadsheet layout
- Drag-and-drop support
- Annotated output
- Rich set of documentation and educational materials
- Supports many formats: (.sav, .txt, .csv, .ods) and own format .jasp
- Change variable types
- Built-in R support
- Plot and diagrams support

Supported analysis and tests
- A/B Test (Beta)
- ANOVA
- ANCOVA
- AUDIT (module)
- Bain (module)
- Binomial Test
- Confirmatory Factor Analysis (CFA)
- Contingency Tables (incl. Chi-Squared Test)
- Correlation: Pearson, Spearman, Kendall
- Equivalence T-Tests: Independent, Paired, One-Sample
- Exploratory Factor Analysis (EFA)
- Linear Regression
- Logistic Regression
- Log-Linear Regression
- Machine Learning
- MANOVA
- Mediation Analysis
- Meta-Analysis
- Mixed Models
- Multinomial
- Principal Component Analysis (PCA)
- Repeated Measures ANOVA
- Reliability Analysis
- Structural Equation Modeling (SEM)
- Summary Stats
- T-Tests: Independent, Paired, One-Sample
- Visual Modeling: Linear, Mixed, Generalized Linear
Platforms
Download and Install JASP
1- Windows
JASP offers a pre-installed two editions for Windows systems: 64-bit and 32-bit versions. It runs from Windows 7, Windows 8, Windows 8.1 and Windows 10.
2- Linux
Flatpak is the primary installation package for Linux distros. It supports any distribution that uses Flatpak.
flatpak remote-add --if-not-exists flathub https://dl.flathub.org/repo/flathub.flatpakrepo
flatpak install flathub org.jaspstats.JASP
3- macOS
For macOS users, JASP offers two packages for macOS Catalina and Mojave/ High Sierra. However, If you have an older macOS version you can still use JASP 0.9.2 which will work.
4- Browser
If you don't want to install JASP or you want to test JASP without installing it, You can lunch JASP in your browser with the support of Rollapp which is a cloud platform that allows running native desktop applications within any web browser.
Here is where you can run it in your web browser.
License
As a complete Libre open-soure solution, JASP is released under a GNU Affero GPL v3 license which guarantees that JASP will be always free.


Resources
- Website: https://jasp-stats.org/
- Flatpak Linux download
- AGPL: https://www.gnu.org/licenses/agpl-3.0.html
- GitHub: https://github.com/jasp-stats/jasp-desktop
- Photo by Burak K from Pexels


