Datoviz: The Future of High-Performance Scientific Data Visualization

What Is Datoviz?
Datoviz, a blazing-fast, GPU-powered visualization library built from the ground up for real-time, interactive exploration of massive datasets.
Datoviz is an open-source, cross-platform rendering engine designed to bring high-performance 2D and 3D data visualization to life using modern GPU acceleration. Built on the Vulkan API, it’s optimized for speed, scalability, and interactivity — delivering performance that can outpace traditional tools like Matplotlib by up to 10,000x.
Core Components:
- GPU Rendering Engine: Leverages Vulkan for low-level, high-efficiency graphics.
- C API & Python Bindings: Low-level control via C, with idiomatic Python support (
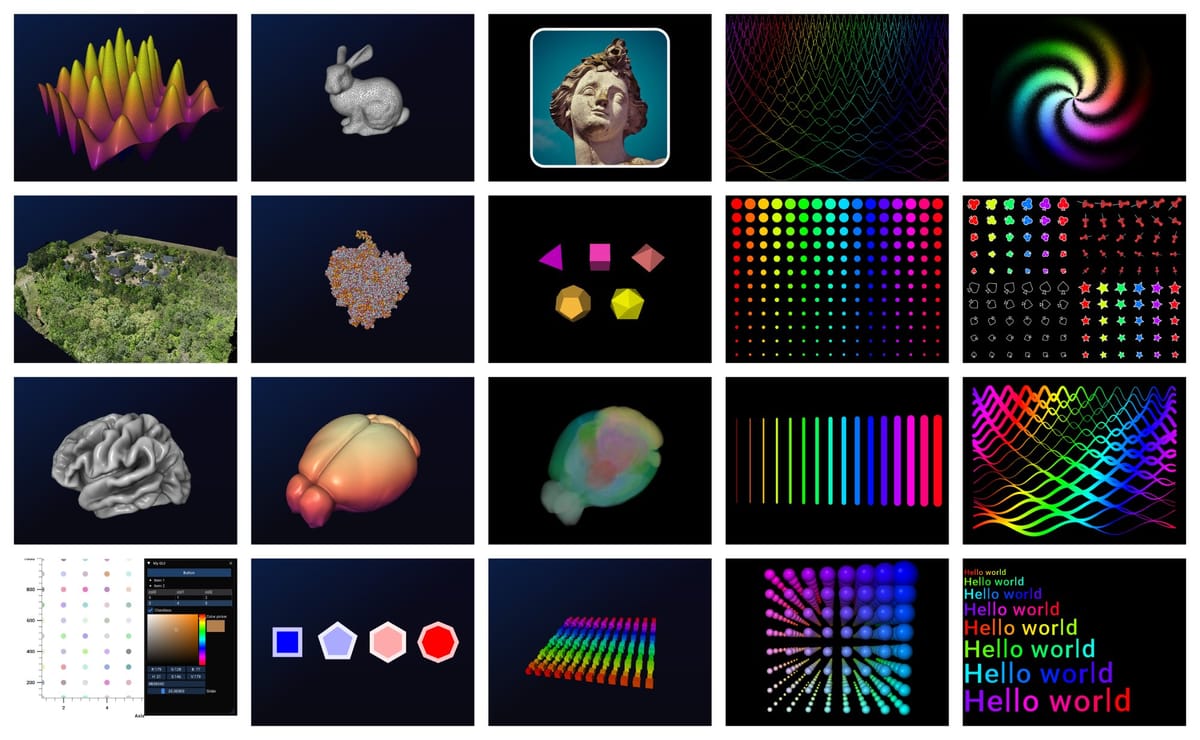
pip install datoviz). - Visual Primitives: Points, markers, lines, paths, images, text, meshes, volumes, and more.
- Interactive GUIs: Powered by Dear ImGui for dynamic controls and user interaction.
- Figure Subplots (Panels): Organize multiple views in one window.
- Built-in Colormaps: 150+ colormaps from matplotlib, colorcet, and MATLAB.
Who Can Use It?
Datoviz is perfect for:
- Scientists & Researchers analyzing large-scale datasets (e.g., neuroscience, genomics, climate modeling).
- Data Engineers & ML Practitioners needing real-time visualization during model training or debugging.
- Developers building interactive dashboards or scientific web apps.
- Educators & Presenters who want smooth, responsive visualizations for lectures or demos.
- Anyone tired of waiting for plots to render when working with millions of points.
It’s especially powerful for anyone pushing the limits of what’s possible with live, interactive data exploration.
Key Features
| Feature | Benefit |
|---|---|
| Real-time rendering | Smooth panning, zooming, and interaction even with millions of elements |
| High-performance 2D/3D visuals | Supports complex scenes with minimal latency |
| Antialiased primitives | Crisp, professional-quality visuals |
| Dynamic shaders & customization | Tailor appearance and behavior down to the pixel level |
| Cross-platform support | Works seamlessly across Linux, macOS, and Windows |
| Lightweight dependencies | Minimal footprint compared to heavy frameworks like VTK |
Future roadmap includes:
- Transparency in 3D
- Multisample anti-aliasing (MSAA)
- Object picking & non-linear transforms
- CUDA & WebGPU backends
- IPython integration & Qt support
Supported Platforms & Installation
Datoviz runs on:
- Linux x86_64 (Ubuntu 22.04+, glibc 2.34+)
- macOS 12+ (Intel and Apple Silicon M1–M4)
- Windows 10+ (x86_64)
✅ Good news for Apple Silicon users: Datoviz fully supports M1, M2, M3, and M4 chips — no emulation needed!
Install with pip (Easiest):
pip install datoviz
For advanced users or developers contributing to the project:
- Build from source using CMake
- Try nightly builds for experimental features
👉 Nightly Releases
👉 GitHub Repository
📄 License
Datoviz is released under the MIT License — permissive, open, and developer-friendly. You can use it in commercial projects, research, education, or personal tools without restrictions.
🌐 Real-World Use Cases
- Neuroscience: Visualizing brain activity maps in real time.
- Medical Imaging: Interactive 3D volume rendering of MRI/CT scans.
- Financial Analytics: Live plotting of stock movements across thousands of instruments.
- Robotics & Simulation: Real-time sensor data visualization during autonomous system testing.
- AI Development: Monitoring training progress with dynamic scatter plots of embeddings.
🚀 Final Thoughts
If you're frustrated by sluggish plots, frozen UIs, or slow rendering times — Datoviz is your upgrade path. It’s not just faster; it’s redefining what’s possible in scientific visualization.
And yes — it’s backed by the same visionaries behind VisPy, with strong funding from Chan Zuckerberg Initiative, Simons Foundation, and Wellcome Trust.
🔗 Get Started Today:
- 📖 User Guide & Examples
- 🐍 GitHub Repo
- 🎥 Watch the benchmark video (coming soon!)
Built for speed. Designed for discovery.
Written with ❤️ by a developer who believes data should be seen — not just processed.