21 Open Source Free Map Design and Geo Visualization Tools

Designing maps might seem easy, but it is not, especially when many tools require certain levels of technical knowledge. A good map design can promote your presentation, website, and increase your work exposure.
Data scientists, business analysts, marketeers, advertisers, and many other professions require map design in their daily work. Some may use free tools and web service like Google Maps, and OpenStreetMap and others.
However, if you are looking for a multi purpose data visualization libraries and frameworks, we got you covered in the following post: 30+ Data Visualization Libraries, Frameworks and Apps, Mastering Data Presentation.
Here, in this article we offer you the best open-source free map design solutions out there.
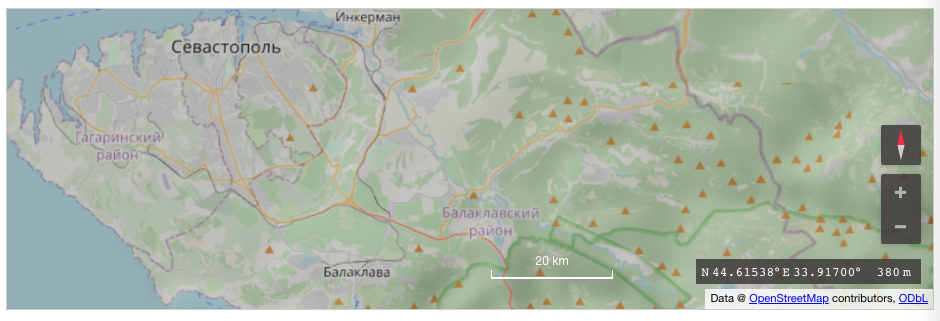
1- Tilemill
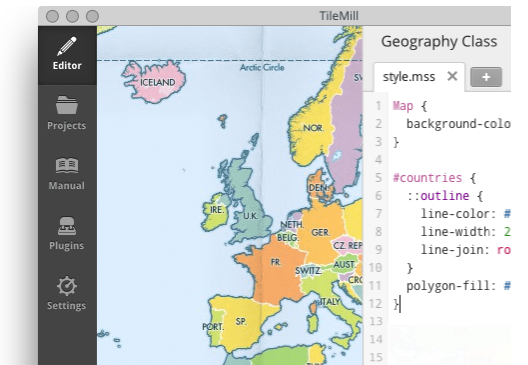
TileMill is an amazing open-source desktop application that helps you design a highly sophisticated stylish and reactive maps in no time.
You can customize your map using CSS or Geography Class (MMS) file, extend your project with plugins, and add more interactive layers to your map.
Tilemill allows you to export your maps in several formats as PNG, PDF, and more.
 Hamza Mousa
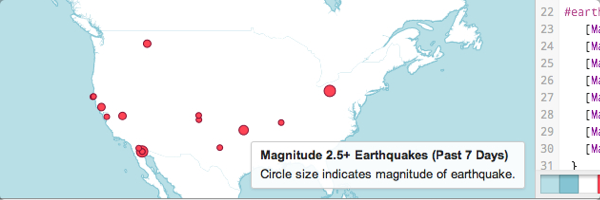
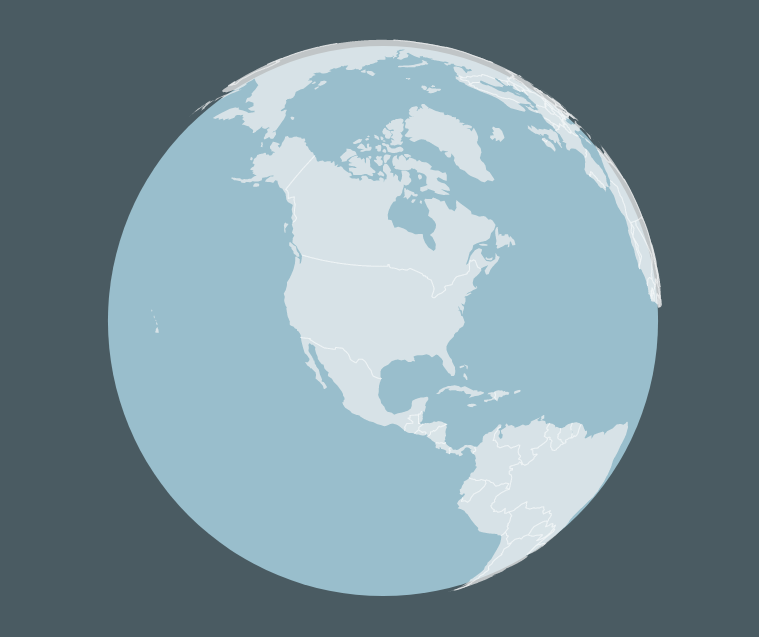
2- OpenGlobus
OpenGlobus is an open-source JavaScript library for building an interactive 3D maps and plants. It supports map tiles, imagery, and vector data.
OpenGlobus uses OpenStreetMaps (OSM) and it works with m any JavaScript frameworks.

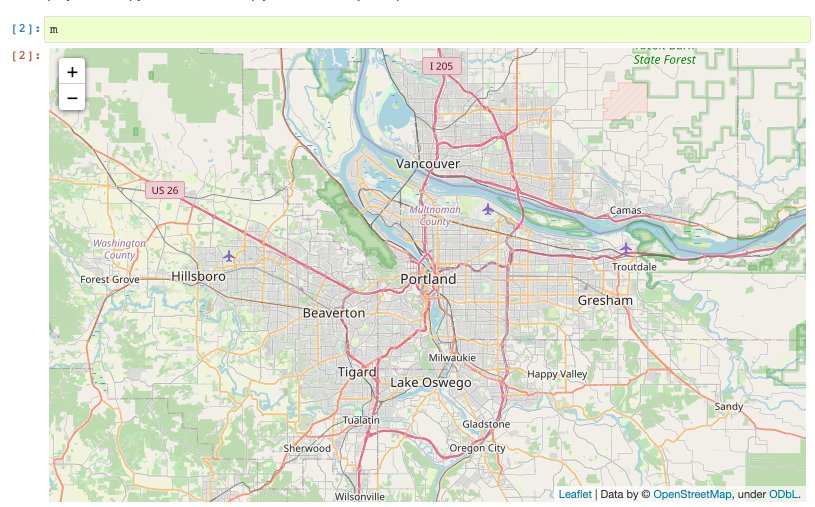
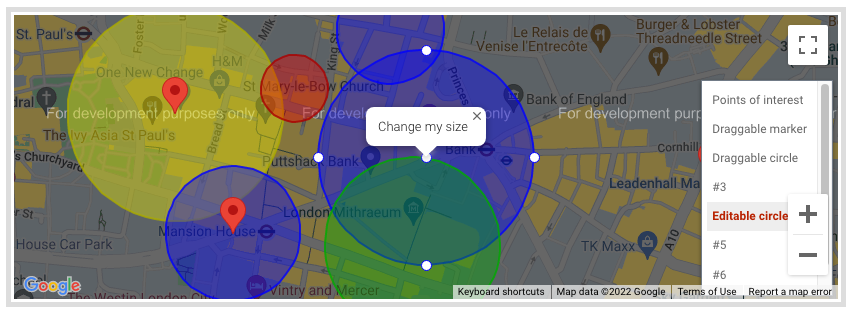
3- Leaflet.js
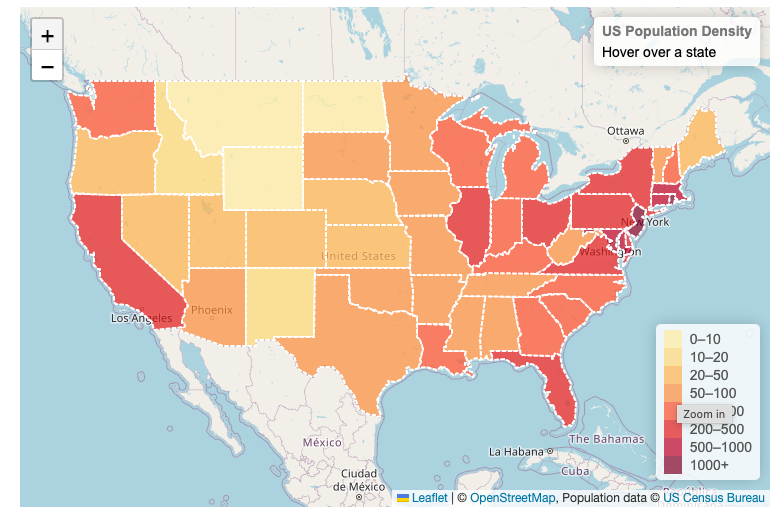
Some may consider Leaflet.js as the right open-source Google Maps alternative. It is an open-source mobile-friendly responsive map library that supports touch, tiles, and plugins.

 Leaflet
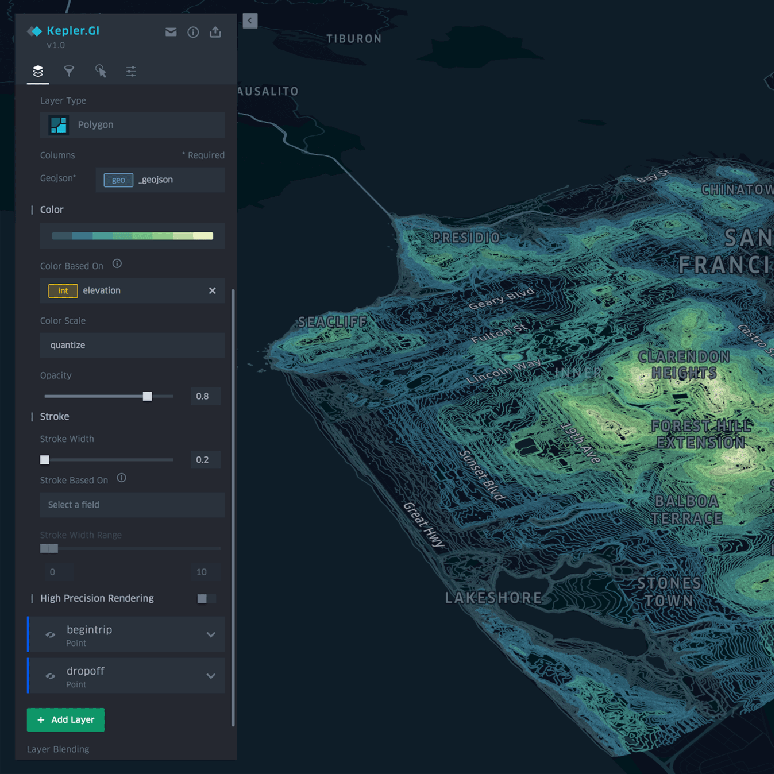
4- Kepler.gl
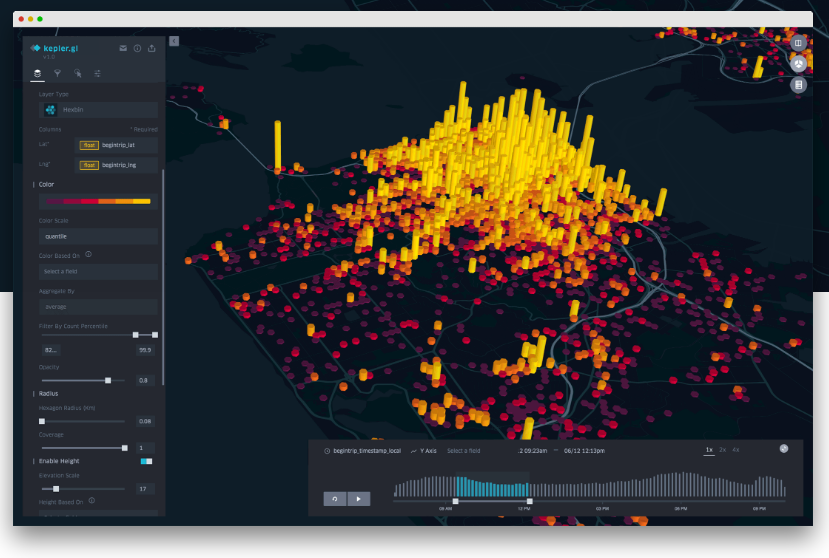
Kepler.gl is a powerful open source geospatial analysis tool for large-scale data sets. It is an ideal solution for created rich and heavy map visualization. Kepler.gl has a dozen of plugins and a strong community of developers who support the project.

 keplergl
5- CesiumJS
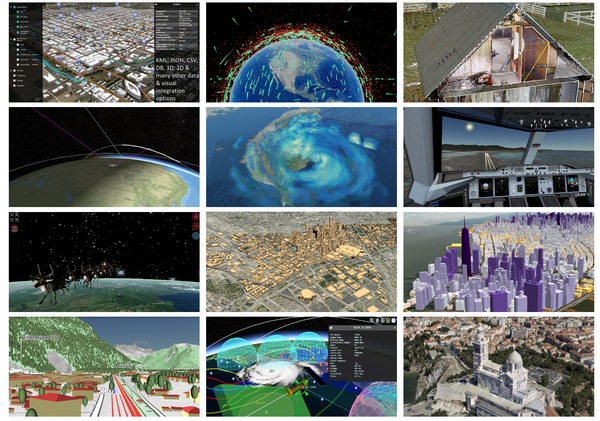
CesiumJS is an open source JavaScript library for creating world-class 3D globes and maps with the best possible performance, precision, visual quality, and ease of use. Developers across industries, from aerospace to smart cities to drones, use CesiumJS to create interactive web apps for sharing dynamic geospatial data.
It works on all modern browsers, and with all popular JavaScript frameworks.
Hamza Mousa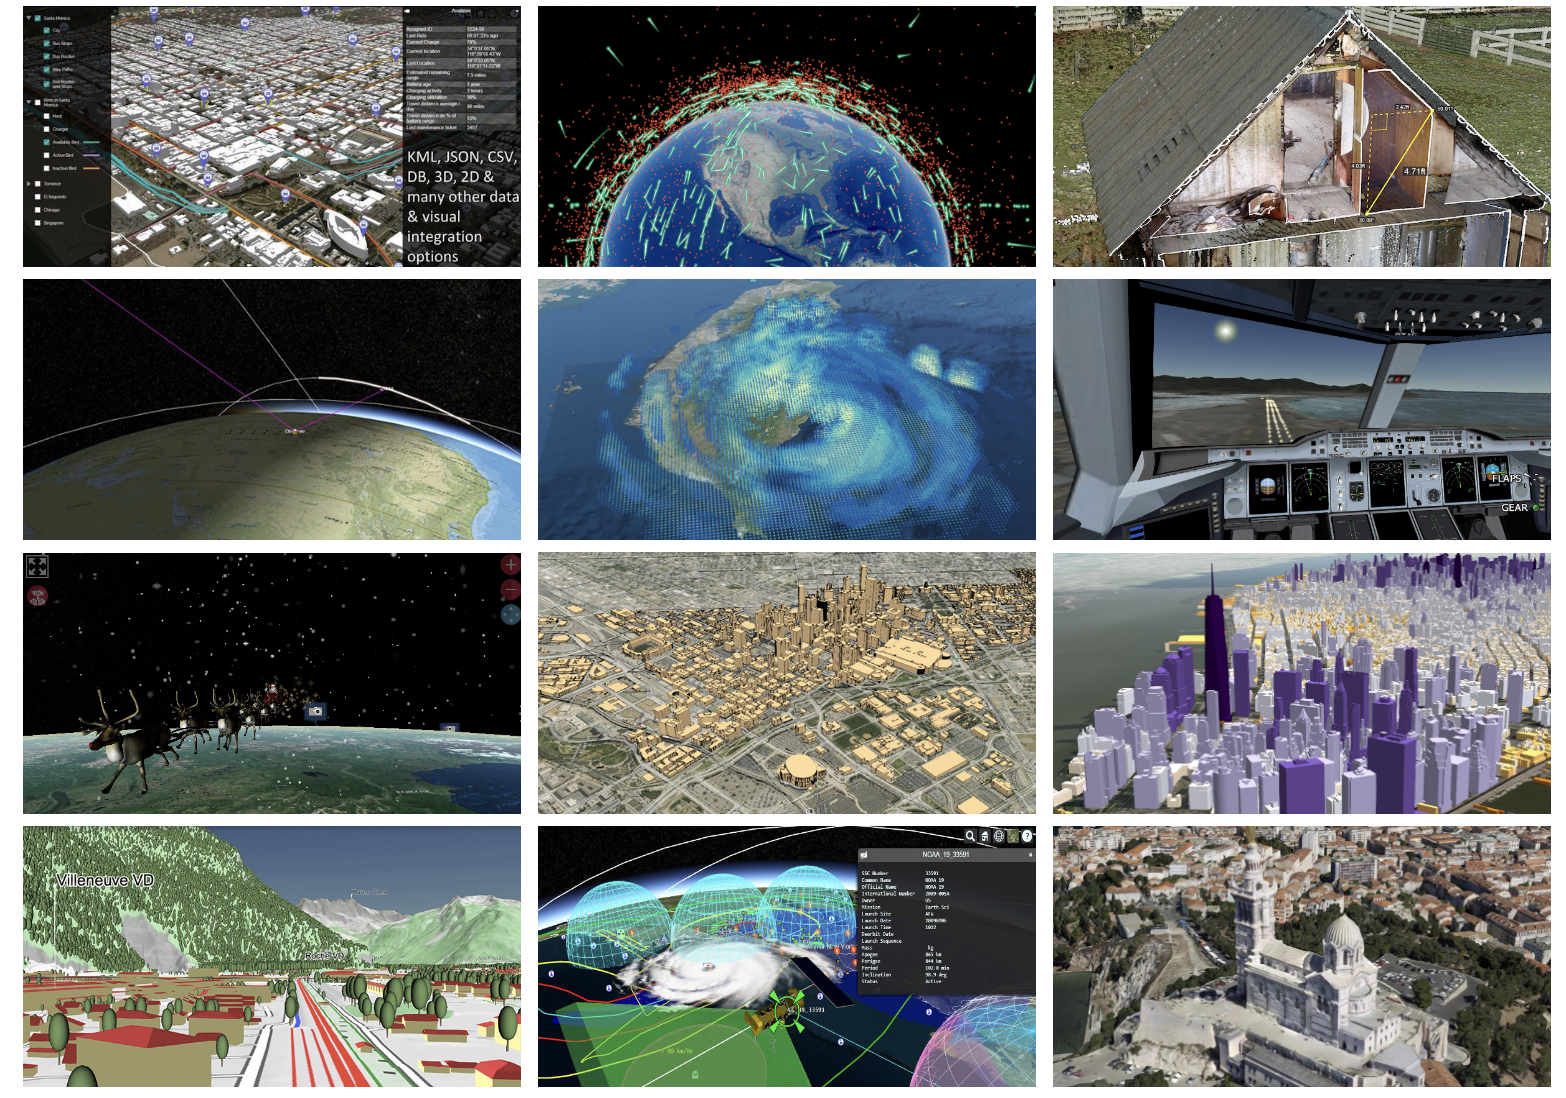
 Patrick Cozzi
6- OpenLayers
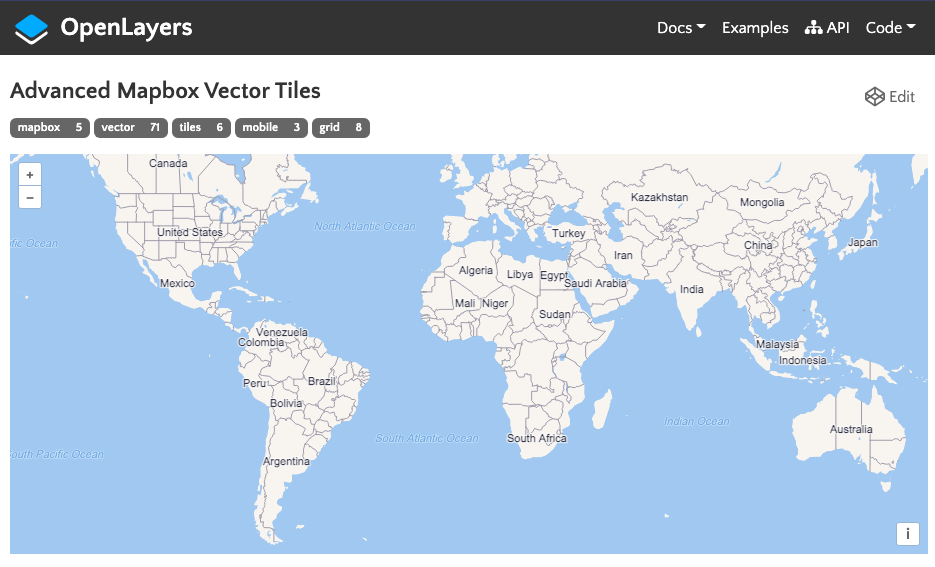
OpenLayers makes it easy to put a dynamic map in any web page. It can display map tiles, vector data and markers loaded from any source. OpenLayers has been developed to further the use of geographic information of all kinds. It is completely free, Open Source JavaScript, released under the 2-clause BSD License (also known as the FreeBSD).
7- The Turing Geo-visualisation Engine (TGVE)
The Turing Geovisualisation Engine (TGVE) is a web-based, interactive visual analytics tool for geospatial data analysis, built using R and JavaScript/React, that can be used as a complete server-client application or just as a front-end stand-alone application.
tgve8- DynamoVis
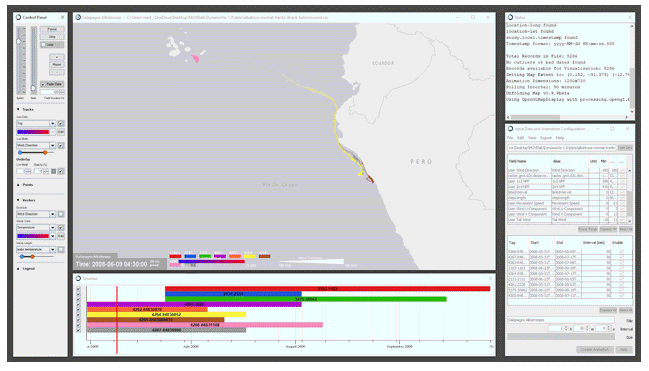
DynamoVis is a data visualization software specifically targeted for spatiotemporal movement data. It is developed by Move Lab @ UC Santa Barbara and designed to be accessible and easily usable for scientists without extensive prior experience with programming, GIS software, or custom data visualization tools.
move-ucsb9- folium
folium builds on the data wrangling strengths of the Python ecosystem and the mapping strengths of the leaflet.js library. Manipulate your data in Python, then visualize it in on a Leaflet map via folium.
folium makes it easy to visualize data that’s been manipulated in Python on an interactive leaflet map. It enables both the binding of data to a map for choropleth visualizations and passing rich vector/raster/HTML visualizations as markers on the map.
python-visualization10- OSMnx
OSMnx is a Python package that lets you download geospatial data from OpenStreetMap and model, project, visualize, and analyze real-world street networks and any other geospatial geometries.
You can download and model walkable, drivable, or bikeable urban networks with a single line of Python code then easily analyze and visualize them. You can just as easily download and work with other infrastructure types, amenities/points of interest, building footprints, elevation data, street bearings/orientations, and speed/travel time.
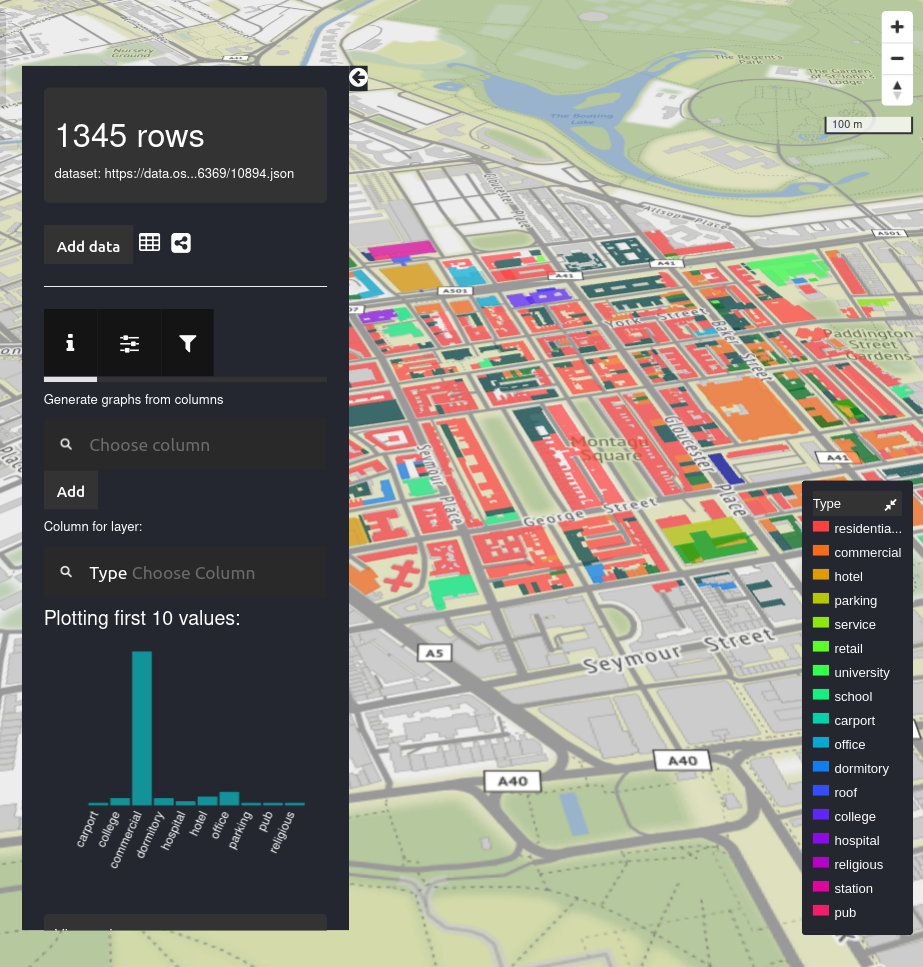
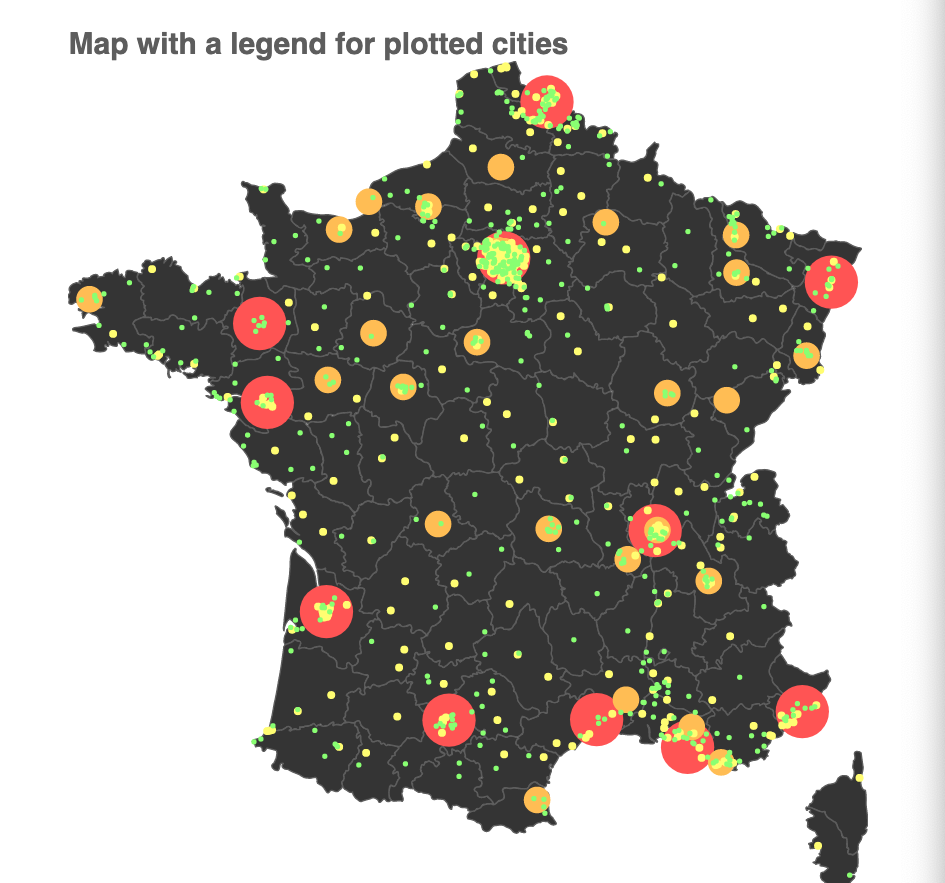
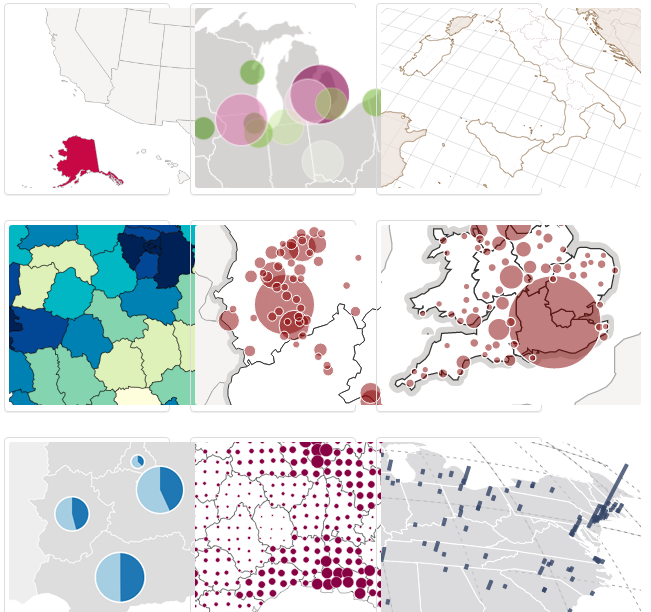
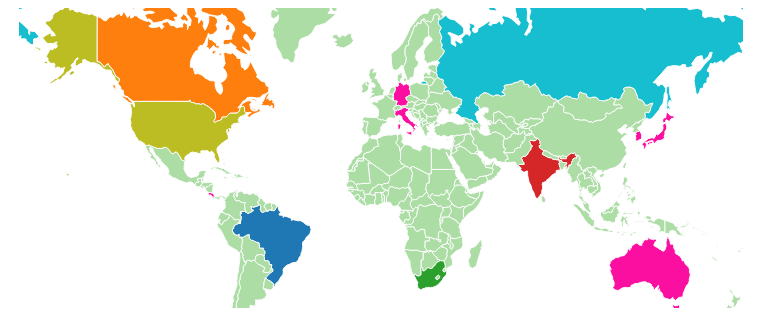
gboeing11- Worldmap.js
WorldMap.js is a JavaScript library based on D3.js to visualize Jason data or spreadsheets on a map by plotting graphs, markers, text, images, arcs and bubbles. It also has some basic GIS functionality such as loading and drawing objects in Geojson format.
The library is fully customizable allowing you to set almost all the styles of the map. You can customize the map style, the objects on the map and the animations by setting custom values into the Worldmap object. You can also choose which data you want to display by selecting specific columns or attributes in the table panel.

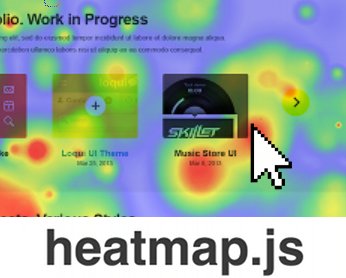
12- heatmap.js
heatmap.js is a lightweight, easy to use JavaScript library to help you visualize your three-dimensional data!

13- jQuery Mapael
jQuery Mapael is a JavaScript library to render and manipulate dynamic vector maps. It is based on Raphael.js library. It renders a responsive map that you can zoom, add tooltips, dynamic events, and plots.
14- Geocomplete
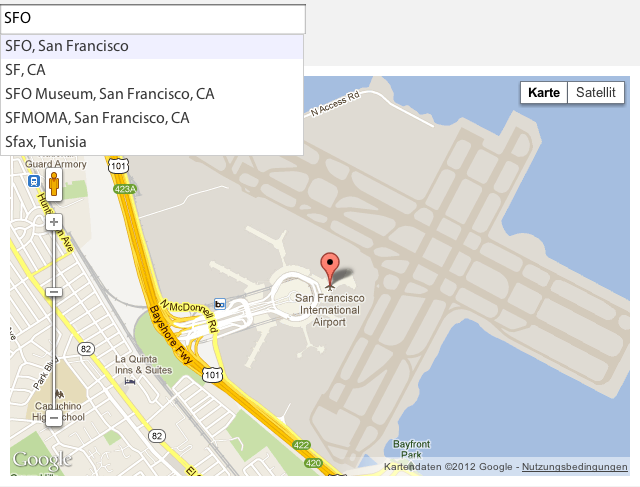
Geocomplete is an advanced jQuery plugin that wraps the Google Maps API's Geocoding and Places Autocomplete services. You simply provide an input that lets you search for locations with a nice autocomplete dropdown. Optionally add a container to show an interactive map and a form that will be populated with the address details.
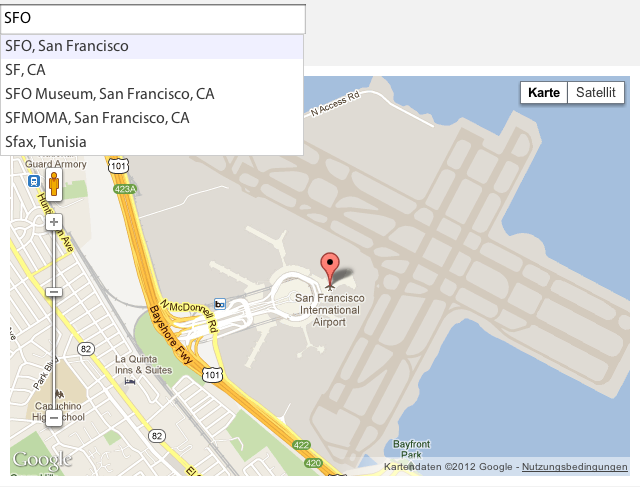 ubilabs
15- Kartograph
Kartograph is a feature-rich map design framework for JavaScript and Python. With it, you can create 3D maps, vector maps, heatmaps, and rich presentation in no time.
The JavaScript library works on all modern web browsers, and it is built on top of Raphael, and jQuery.

16- D3.js
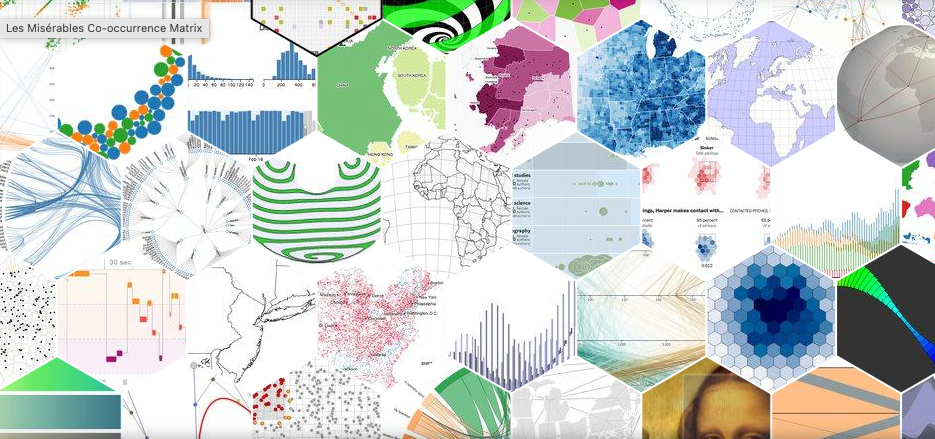
D3.js is a rich JavaScript library for building interactive data visualization on top of web technologies as HTML, SVG, and CSS.
The D3 stands for Data-Driven Documents. It can be easily integrated with other JavaScript frameworks as React, Vue, and Angular.
D3.js has a rich community of developers that support it by adding code samples, open-source libraries and more.
d317- DataMaps
Datamaps is intended to provide some data visualizations based on geographical data. It's SVG-based, can scale to any screen size, and includes everything inside 1 script file. It heavily relies on the amazing D3.js library.
 markmarkoh
18- Maplace.Js
Maplace.js helps you to embed Google Maps into your website, quickly create markers and controls menu for the locations on map.
It requires jQuery and Google Maps API v3, so you need to have both in your page.

19- Stately
Stately is a symbol font that makes is easy to create a map of the United States using only HTML and CSS. Each state can be styled independently with CSS for making simple visualizations. And since it's a font, it scales bigger and smaller while staying sharp as a tack.
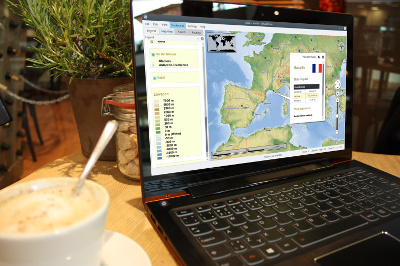
mobomo20- Marble
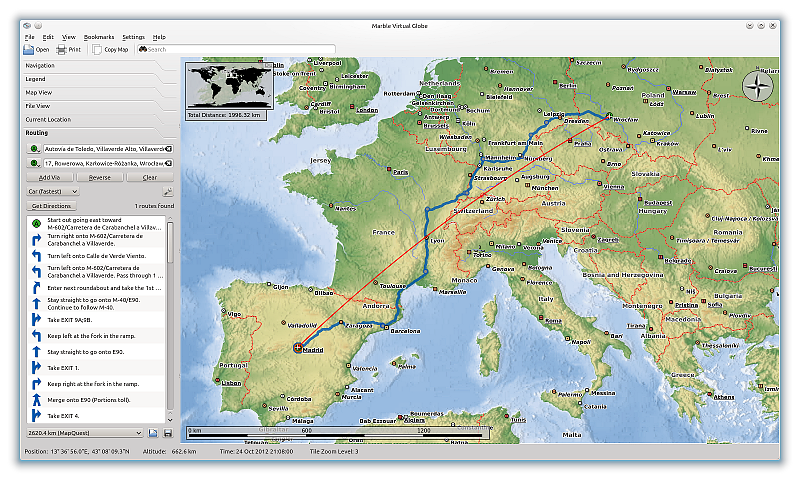
Marble is a free open source globe and virtual atlas for Linux, Windows, , macOS and, mobile (Android, and iOS).
Marble allows you to explore cities, countries, historical maps, plants, and more. It also comes with a rich search options that searches for everything, and works in offline mode for desktop installations.
21- React Simple Maps
React Simple Maps is an SVG maps library for React, that uses d3-geo library and topojson. It comes with a developer-friendly documentation, a dozen of examples, and a flexible API.
Hamza Mousa
If you know of any other open-source free map visualization tool that we did not mention here, let us know.