14 Free Open-source Self-hosted Observability and APM Solutions


Have you ever had that sinking feeling when a client messages you saying "the app is slow" and you have absolutely no idea why?
I've been there more times than I'd like to admit.
You start guessing. Maybe it's the database. Maybe it's the server. Maybe it's their internet connection. You spend hours digging through logs, running tests, and still end up frustrated.
Here's the thing: it doesn't have to be this way.
What Exactly Are We Talking About?
Let me break this down in plain language.
Imagine you're driving a car. Your dashboard tells you how fast you're going, how much fuel you have, and if the engine is overheating. That's helpful. But what happens when the check engine light comes on? You know something is wrong, but you don't know what.
Now imagine you had a mechanic riding with you who could instantly tell you exactly which sensor failed, why it failed, and what you need to do to fix it. That's the difference between traditional monitoring and what we call observability.
Observability is about understanding what's happening inside your systems by looking at the data they produce. It answers the "why" behind the "what."
The Three Pieces of the Puzzle
Every observability strategy relies on three types of data working together:
1- The Numbers
These are your metrics. How many people are using your app right now? How long does it take for a page to load? How much memory is your server using? These numbers give you the big picture and help you spot trends over time.
2- The Stories
These are your logs. Every time something happens in your system—a user logs in, a request fails, a sensor sends data—you can record that event as a log. Logs tell the story of what happened, moment by moment.
3- The Journey
This is tracing. When a user clicks a button, that action might travel through your frontend, your API, your database, and a third-party service. Tracing follows that entire journey and shows you exactly where time was spent and where things went wrong.
When you combine these three, you stop guessing. You start knowing.
Why This Matters for Agencies
If you're running an agency or building applications for clients, observability isn't just a technical detail. It's a business advantage.
You Solve Problems Before Clients Notice
Imagine sending an email to a client that says: "We noticed your API response times increased yesterday afternoon due to a database query that's grown slower as your user base expanded. We've already fixed it and performance is back to normal."
That client isn't just happy. They're impressed. You've turned support into proactive partnership.
You Stop Wasting Hours Debugging
Every minute your team spends hunting for bugs in the dark is a minute they're not building new features. Observability cuts that time dramatically. What used to take hours becomes minutes.
You Build Trust with Data
When a client says "the app is slow," you can show them exactly what's happening. Not with guesses, but with real data. Maybe the problem is actually their office Wi-Fi. Maybe it's a third-party service you both rely on. Either way, you have proof. And proof builds trust.
You Know What to Fix First
Without observability, you're optimizing blind. You fix what feels slow. With observability, you fix what actually is slow. You prioritize based on facts, not feelings.
A Real Scenario
Let me paint a picture.
You built an app for a school. Kids use it to control a greenhouse sensor kit. One day, the teacher emails: "The automation isn't working. Kids are upset."
Without observability, you're logging into servers, checking logs, reproducing the issue, and hoping you spot the problem. It could take hours.
With observability, you open your dashboard. You search for traces related to that automation. Within seconds, you see exactly where the failure happened: the sensor's battery was low, so it missed the command.
You email the teacher: "Looks like the battery needs replacing." Problem solved before lunch. You look like a hero.
Here are the top open-source APN solutions:
1- Seq
Seq is a powerful, self-hosted platform used for Observability and Debugging modern applications and services.
Its core function is to be a centralized system for collecting, searching, analyzing, and alerting on two of the three pillars of modern observability: structured logs and distributed traces.
Seq is used by Nasa, Amazon, BOSCH, CocaCola, and dozens of other premium users.
Seq's features include:
- Universal Data Collection: Ingests logs & traces from any language via HTTP, OpenTelemetry, or custom inputs.
- Structured Data Preservation: Retains full JSON context and critical metadata from events.
- Real-Time Performance: Offers instant search (no indexing delay) using free-text, regex, and expression queries.
- Distributed Tracing: Provides end-to-end trace analysis for performance and dependency troubleshooting.
- Deep Analysis: Supports aggregate queries and time-slicing for trend analysis (latency, errors).
- Custom Visualization: Build rich dashboards using structured log and trace data for KPIs.
- Smart Alerting: Delivers notifications (Slack, Teams, SMTP) based on custom conditions to preempt user impact.
- Full Self-Hosting: Ensures data security and privacy by running on-premises or in your cloud environment.
- Extensible: Write custom integrations using C# library or CLI tools in any language.
- Industry Trusted: Proven in high-stakes environments, used by NASA, Amazon, Coca-Cola, and more.
- Privacy-First: Zero data collection by the vendor (Datalust) and no vendor lock-in.
- Developer-Focused Architecture: Open, reliable, and easily maintainable.
2- OpenObserve
OpenObserve (O2) is a modern, open-source observability platform designed as a high-performance, cost-effective alternative to tools like Elasticsearch, Splunk, and Datadog. It unifies logs, metrics, traces, real user monitoring (RUM), and analytics in a single, easy-to-deploy system.
OpenObserve's features:
- 140x Lower Storage Cost: Achieved through Parquet columnar storage, aggressive compression, and S3-native architecture.
- Blazing Fast Performance: Outperforms Elasticsearch with 1/4th the hardware resources; uses Rust for memory safety and speed.
- Simple & Scalable: Start with a single binary in under 2 minutes. Scales to terabytes on one node, petabytes in High Availability mode.
- All-in-One Platform: Native UI, SQL/PromQL querying, dashboards, alerts, pipelines, and multi-tenancy — no separate frontends or complex setups.
- Open Source (AGPL-3.0): Fully free and community-driven. Enterprise edition offers SSO, RBAC, audit trails, federated search, and sensitive data redaction.
- Production-Proven: Thousands of deployments worldwide; processes up to 2 PB/day of data in real production environments.
- Secure & Compliant: SOC 2 Type II, ISO 27001, GDPR, HIPAA-ready (BAA available).
3- SigNoz
SigNoz is a free, open-source observability tool that helps you monitor your apps and infrastructure with ease, no expensive subscriptions needed. It’s built for OpenTelemetry, so it works seamlessly with modern tech stacks and gives you full visibility into logs, metrics, and traces in one place.
It is perfect for developers and teams looking for a reliable, private, and cost-effective alternative to Datadog or New Relic, SigNoz delivers real-time insights, fast search, and powerful dashboards—all self-hosted and fully under your control.
4- Netdata
Netdata is an open-source, real-time infrastructure monitoring platform. Monitor, detect, and act across your entire infrastructure.
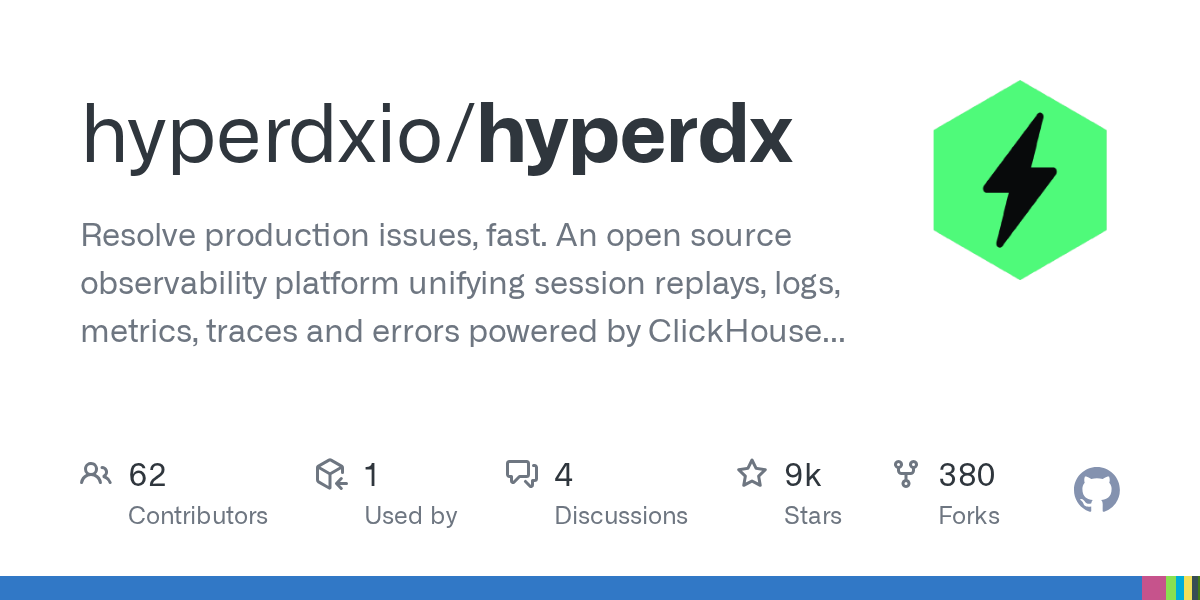
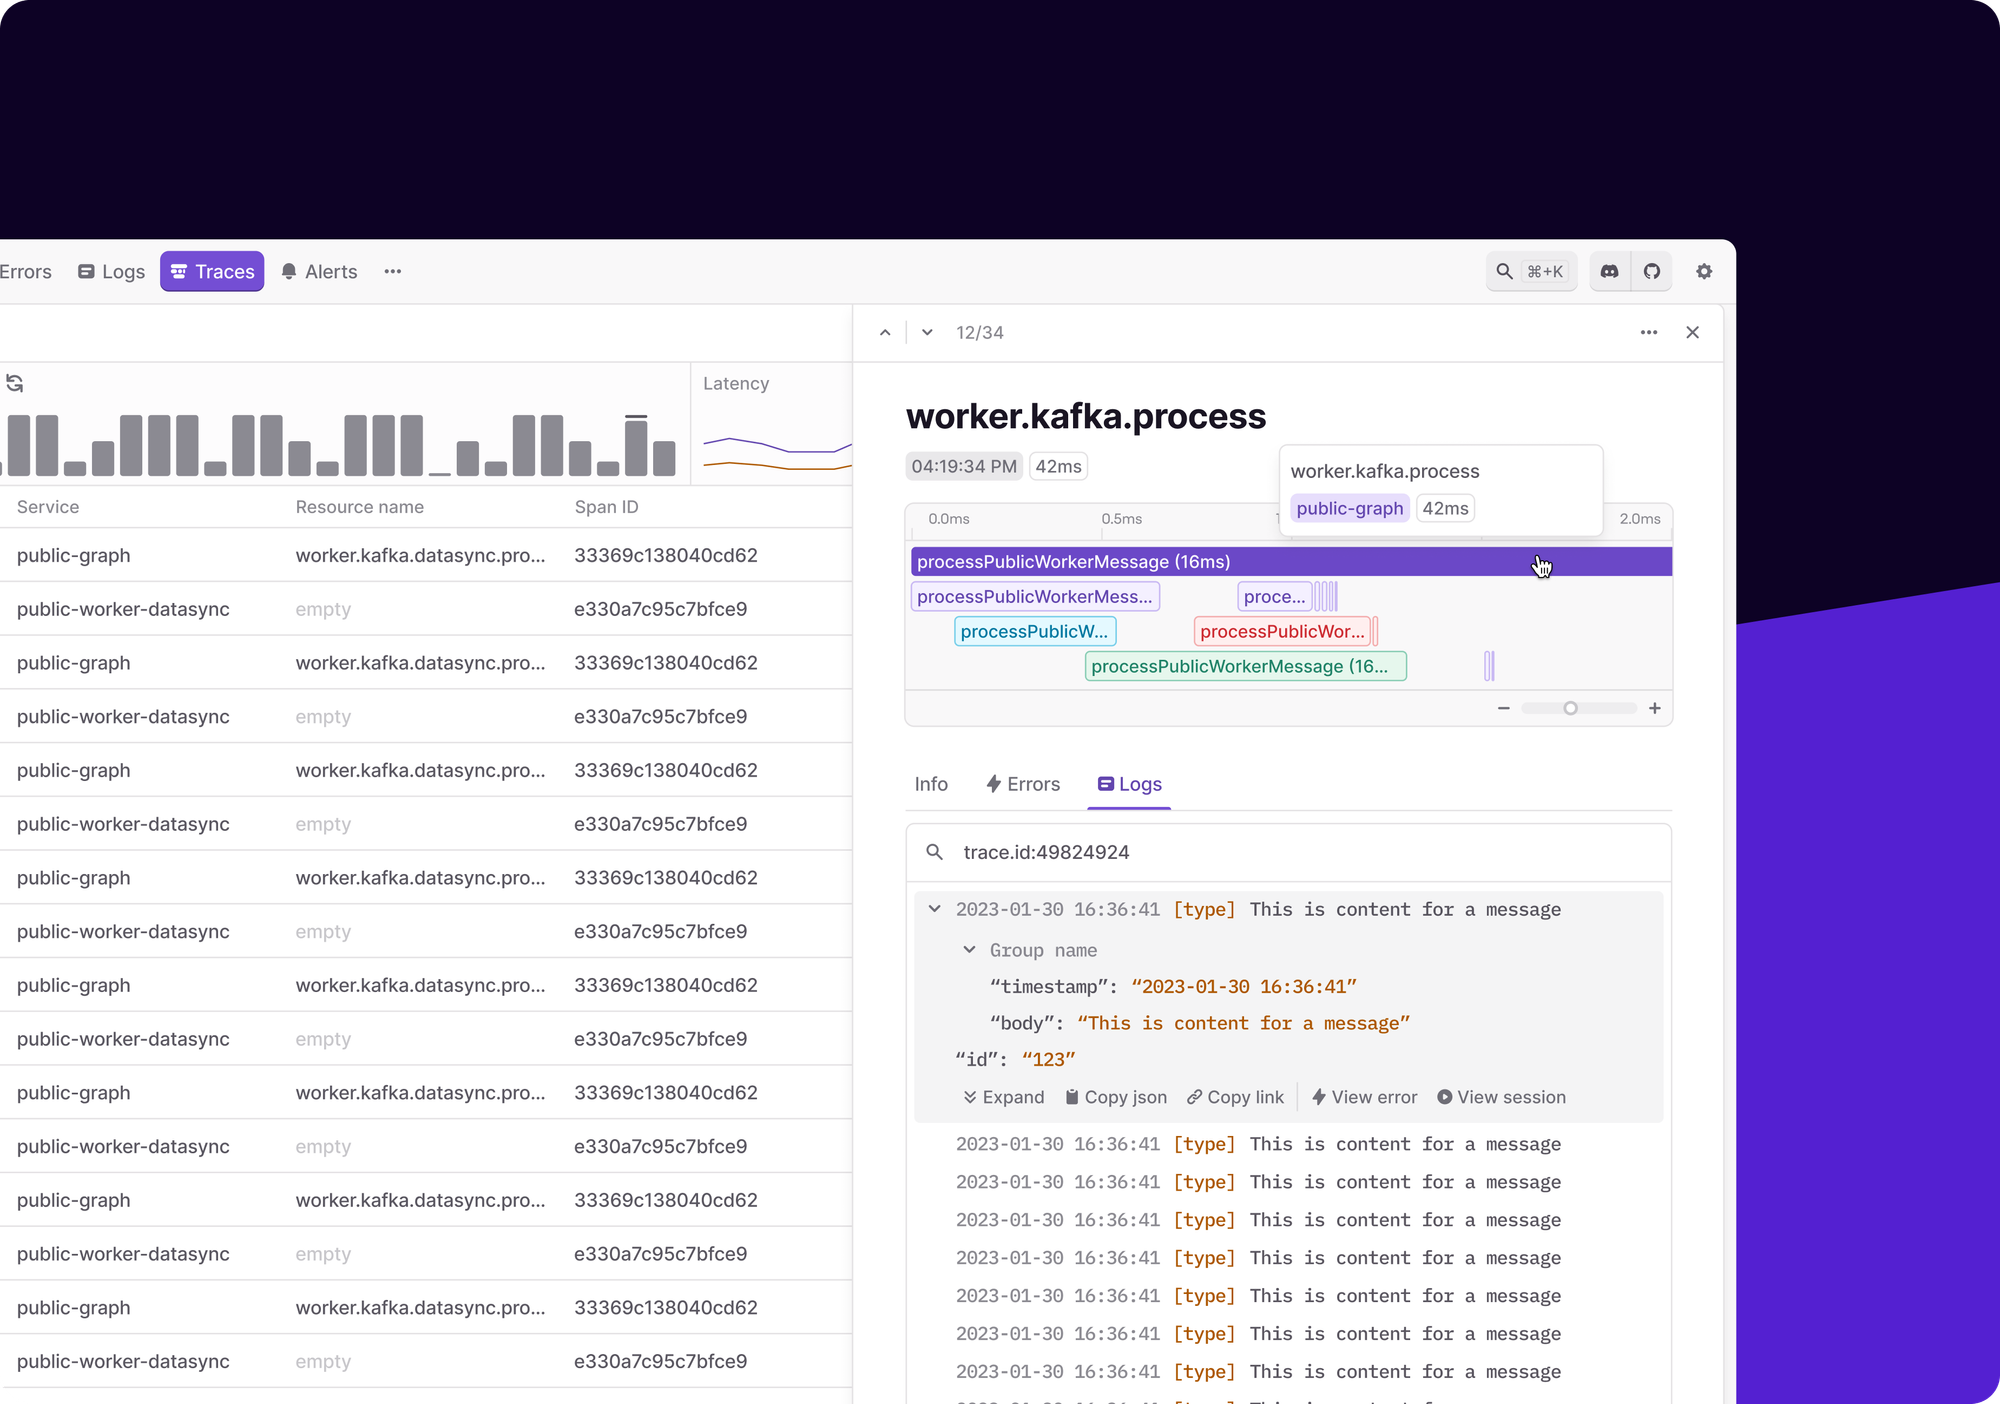
5- HyperDX
HyperDX is an open-source observability tool built on top of ClickHouse. Think of it as a simpler, faster way to search and visualize all your telemetry data without the headaches.
Its features list:
- Unified View: Correlate logs, metrics, session replays, and traces all in one place
- Works with Your Data: Schema agnostic; runs on top of your existing ClickHouse cluster
- Blazing Fast: Searches and visualizations optimized specifically for ClickHouse
- Intuitive Search: Full-text and property search like
level:err; SQL optional - Anomaly Detection: Spot trends and analyze anomalies with event deltas
- Simple Alerts: Set up alerts in just a few clicks
- High-Cardinality Dashboards: Visualize complex events without learning a complex query language
- Native JSON Querying: Query JSON strings directly
- Live Tail: Stream logs and traces in real time for the freshest events
- OpenTelemetry Native: Supported out of the box
- APM Built-In: Monitor health and performance from HTTP requests to database queries
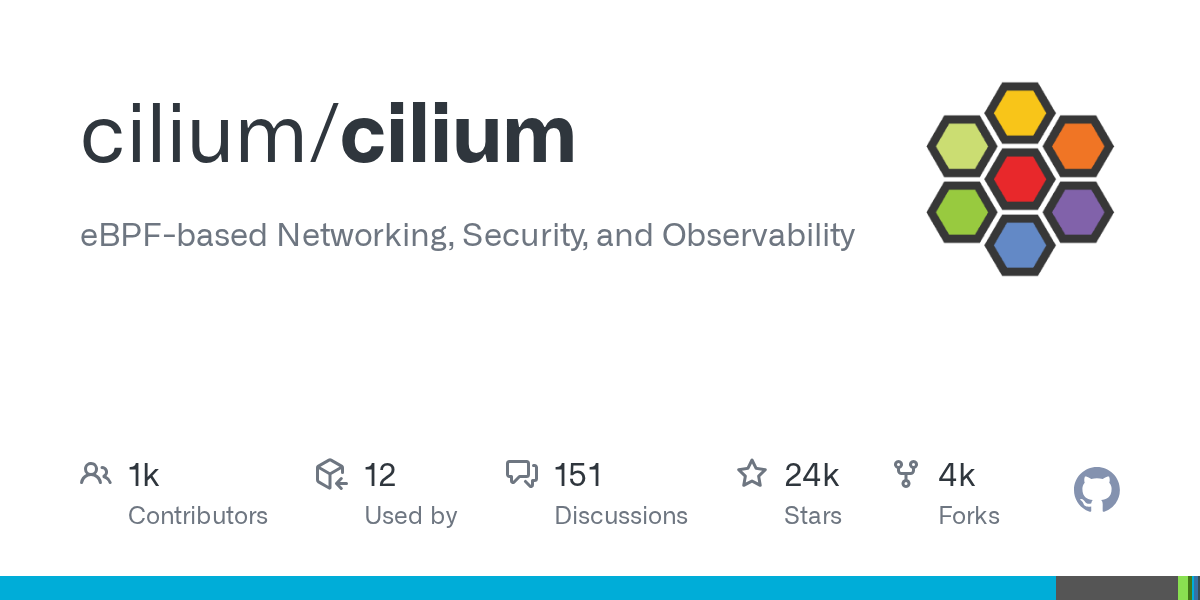
6- Cilium
Cilium is a networking, observability, and security tool built on eBPF. It handles load balancing, network policies, and service mesh, replacing kube-proxy while providing deep visibility across clusters. Simple flat networking with identity-based security.
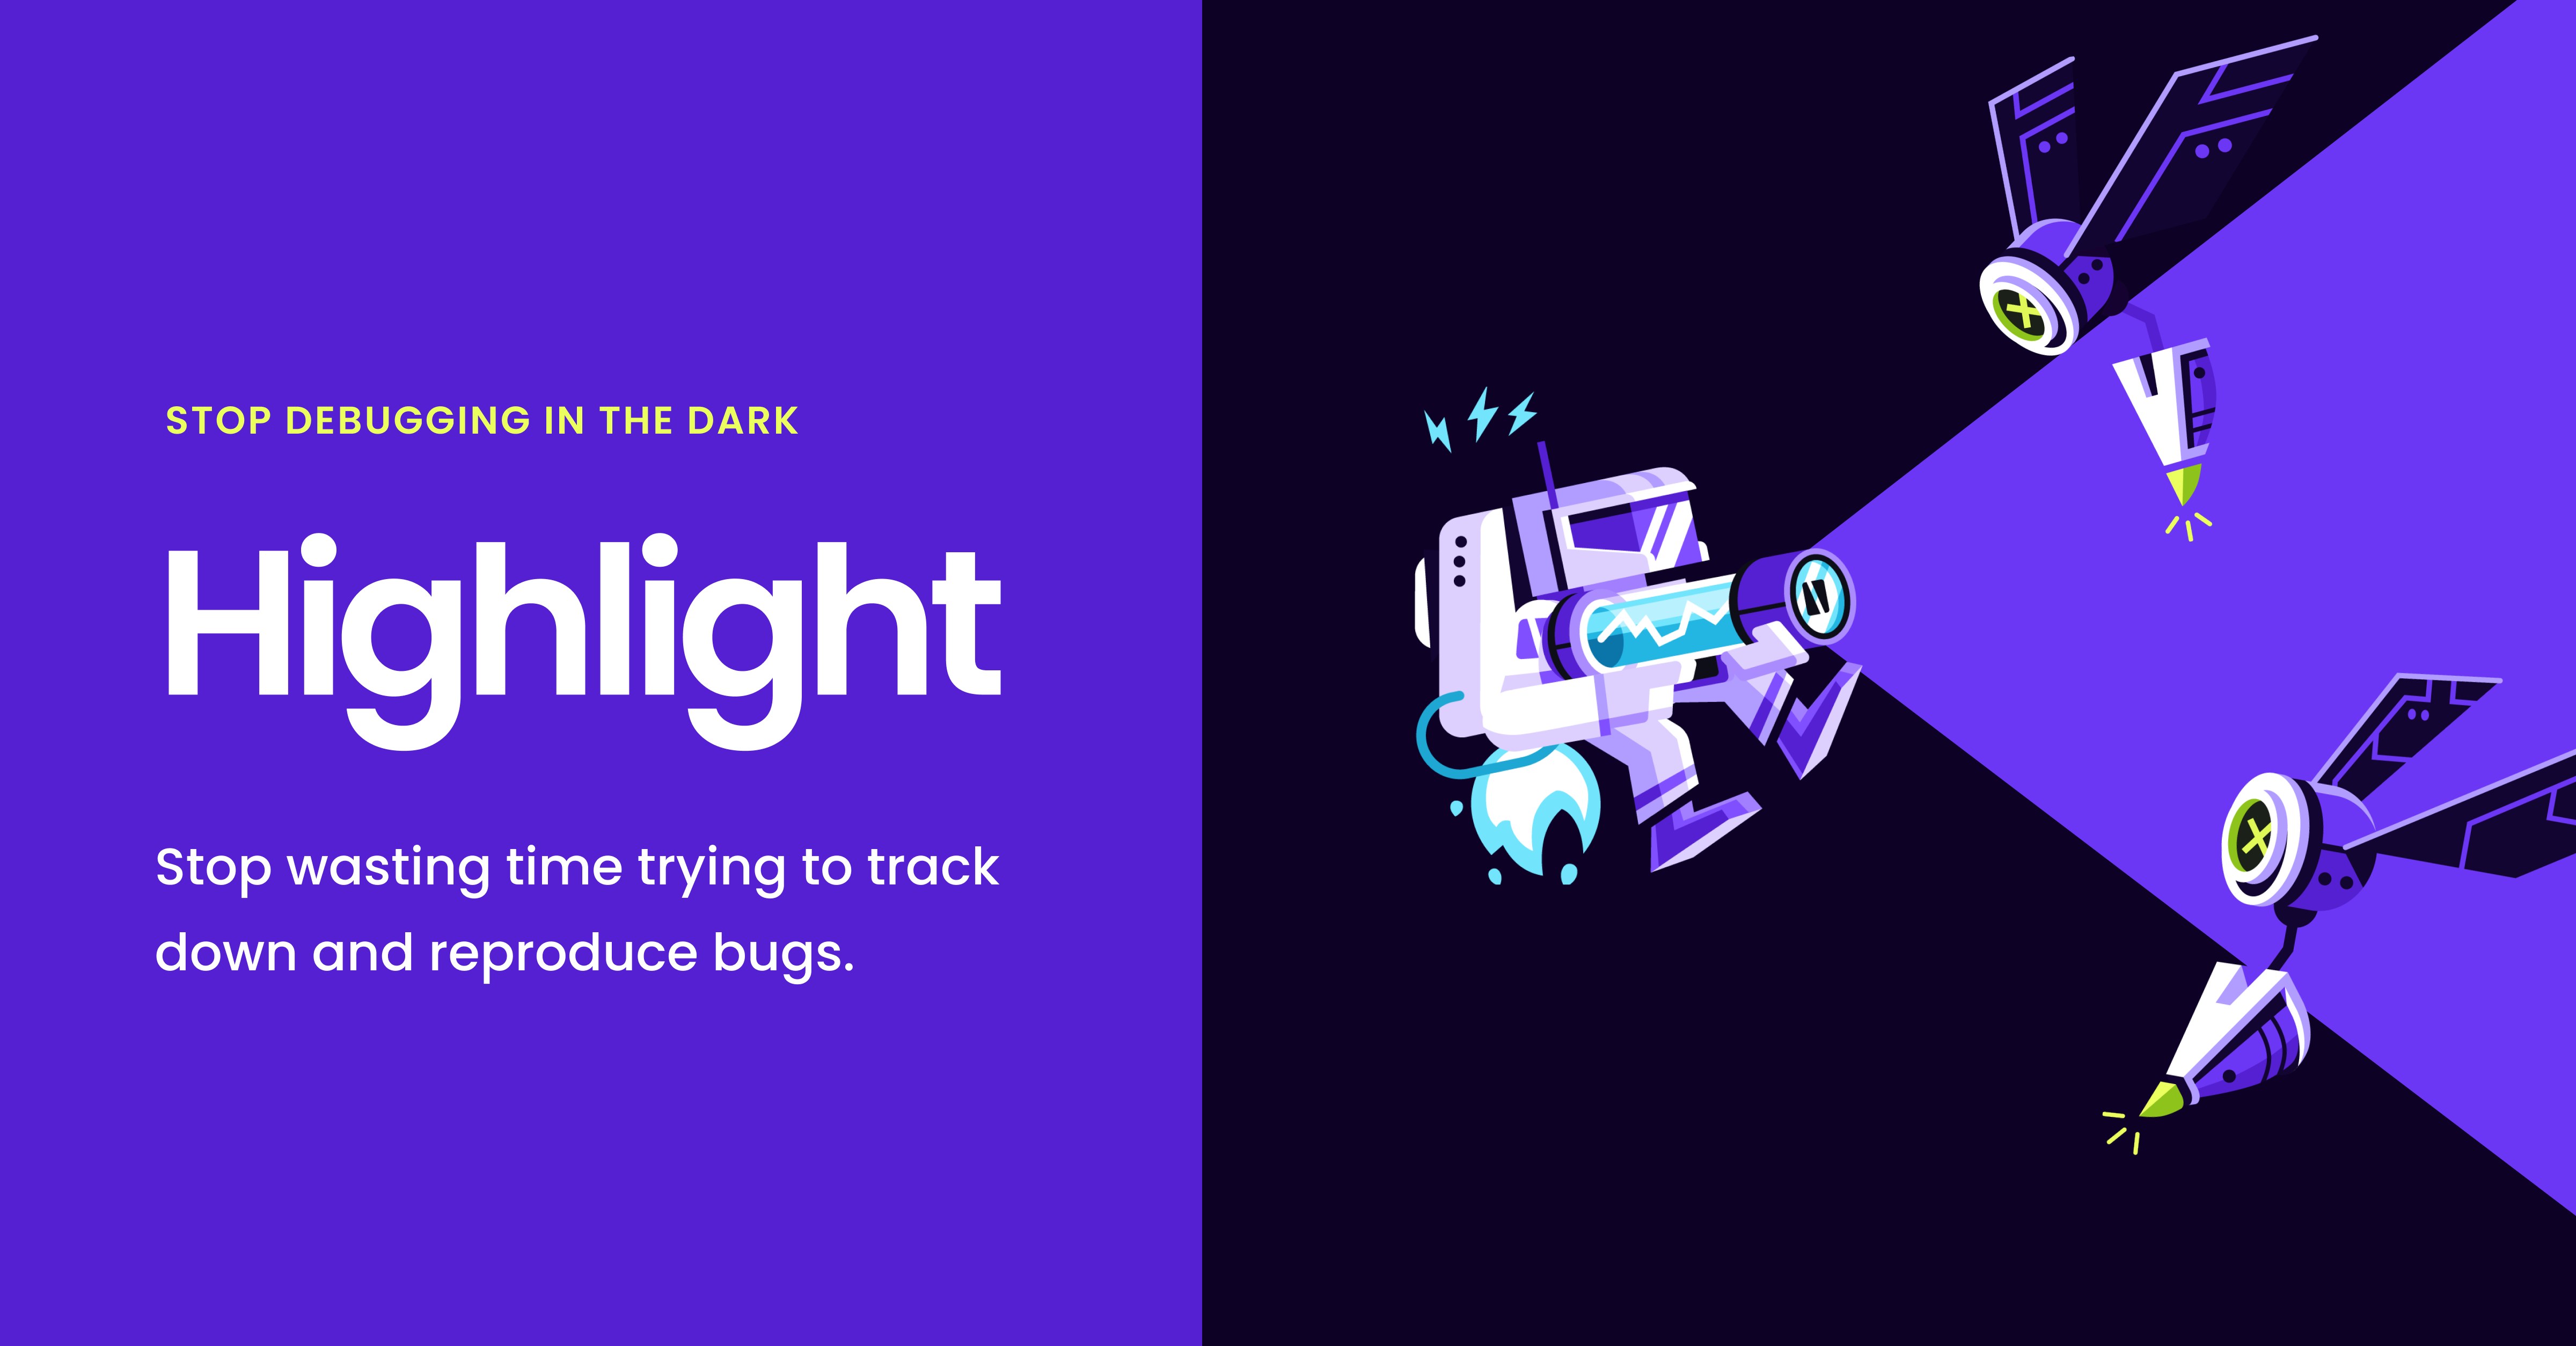
7- Highlight
Highlight.io is an open-source, full-stack monitoring platform built for modern developers. It offers a cohesive, fully-featured alternative to outdated tools, all under an open-source license. Monitoring, simplified.
Session Replay
- High-fidelity replay of every click, scroll, and DOM change from real user sessions
- See all outgoing network requests and their contents
- View console logs printed during the session
- Embedded error monitoring shows what errors occurred and what the user was doing beforehand
- Comment on sessions to communicate with your team about bugs and user frustration
Error Monitoring
- Customizable error grouping rules to consolidate repeated issues
- Custom alerting rules with flexible frequency and destination controls
- Every error shows the session replay that triggered it
- SDK support for a growing list of languages and frameworks
Logs
- Powerful search across all logs with automatic property collection
- Set thresholds for log alerts and view them in the alerts dashboard
- Every log connects to related sessions, errors, and traces
- SDK support for a wide range of languages and frameworks
Traces
- Search across all traces with automatic property collection
- Set thresholds for trace alerts
- Every trace shows associated sessions, errors, and logs
- SDK support including OpenTelemetry
Integrations
- Connect with your favorite tools across all four pillars of monitoring
8- Coroot
Coroot is an open-source observability tool that uses eBPF for zero-instrumentation monitoring. It transforms metrics, logs, and traces into actionable insights with automatic service mapping, real-time health checks, and enterprise-grade functionality, all self-hosted and cost-free.
9- Jaeger
Jaeger is an open-source, cloud-native distributed tracing platform built for microservices architectures. It maps requests as they flow across services, helping you find bottlenecks, troubleshoot errors, and understand service dependencies. Connects the dots so you can fix what's broken, faster.

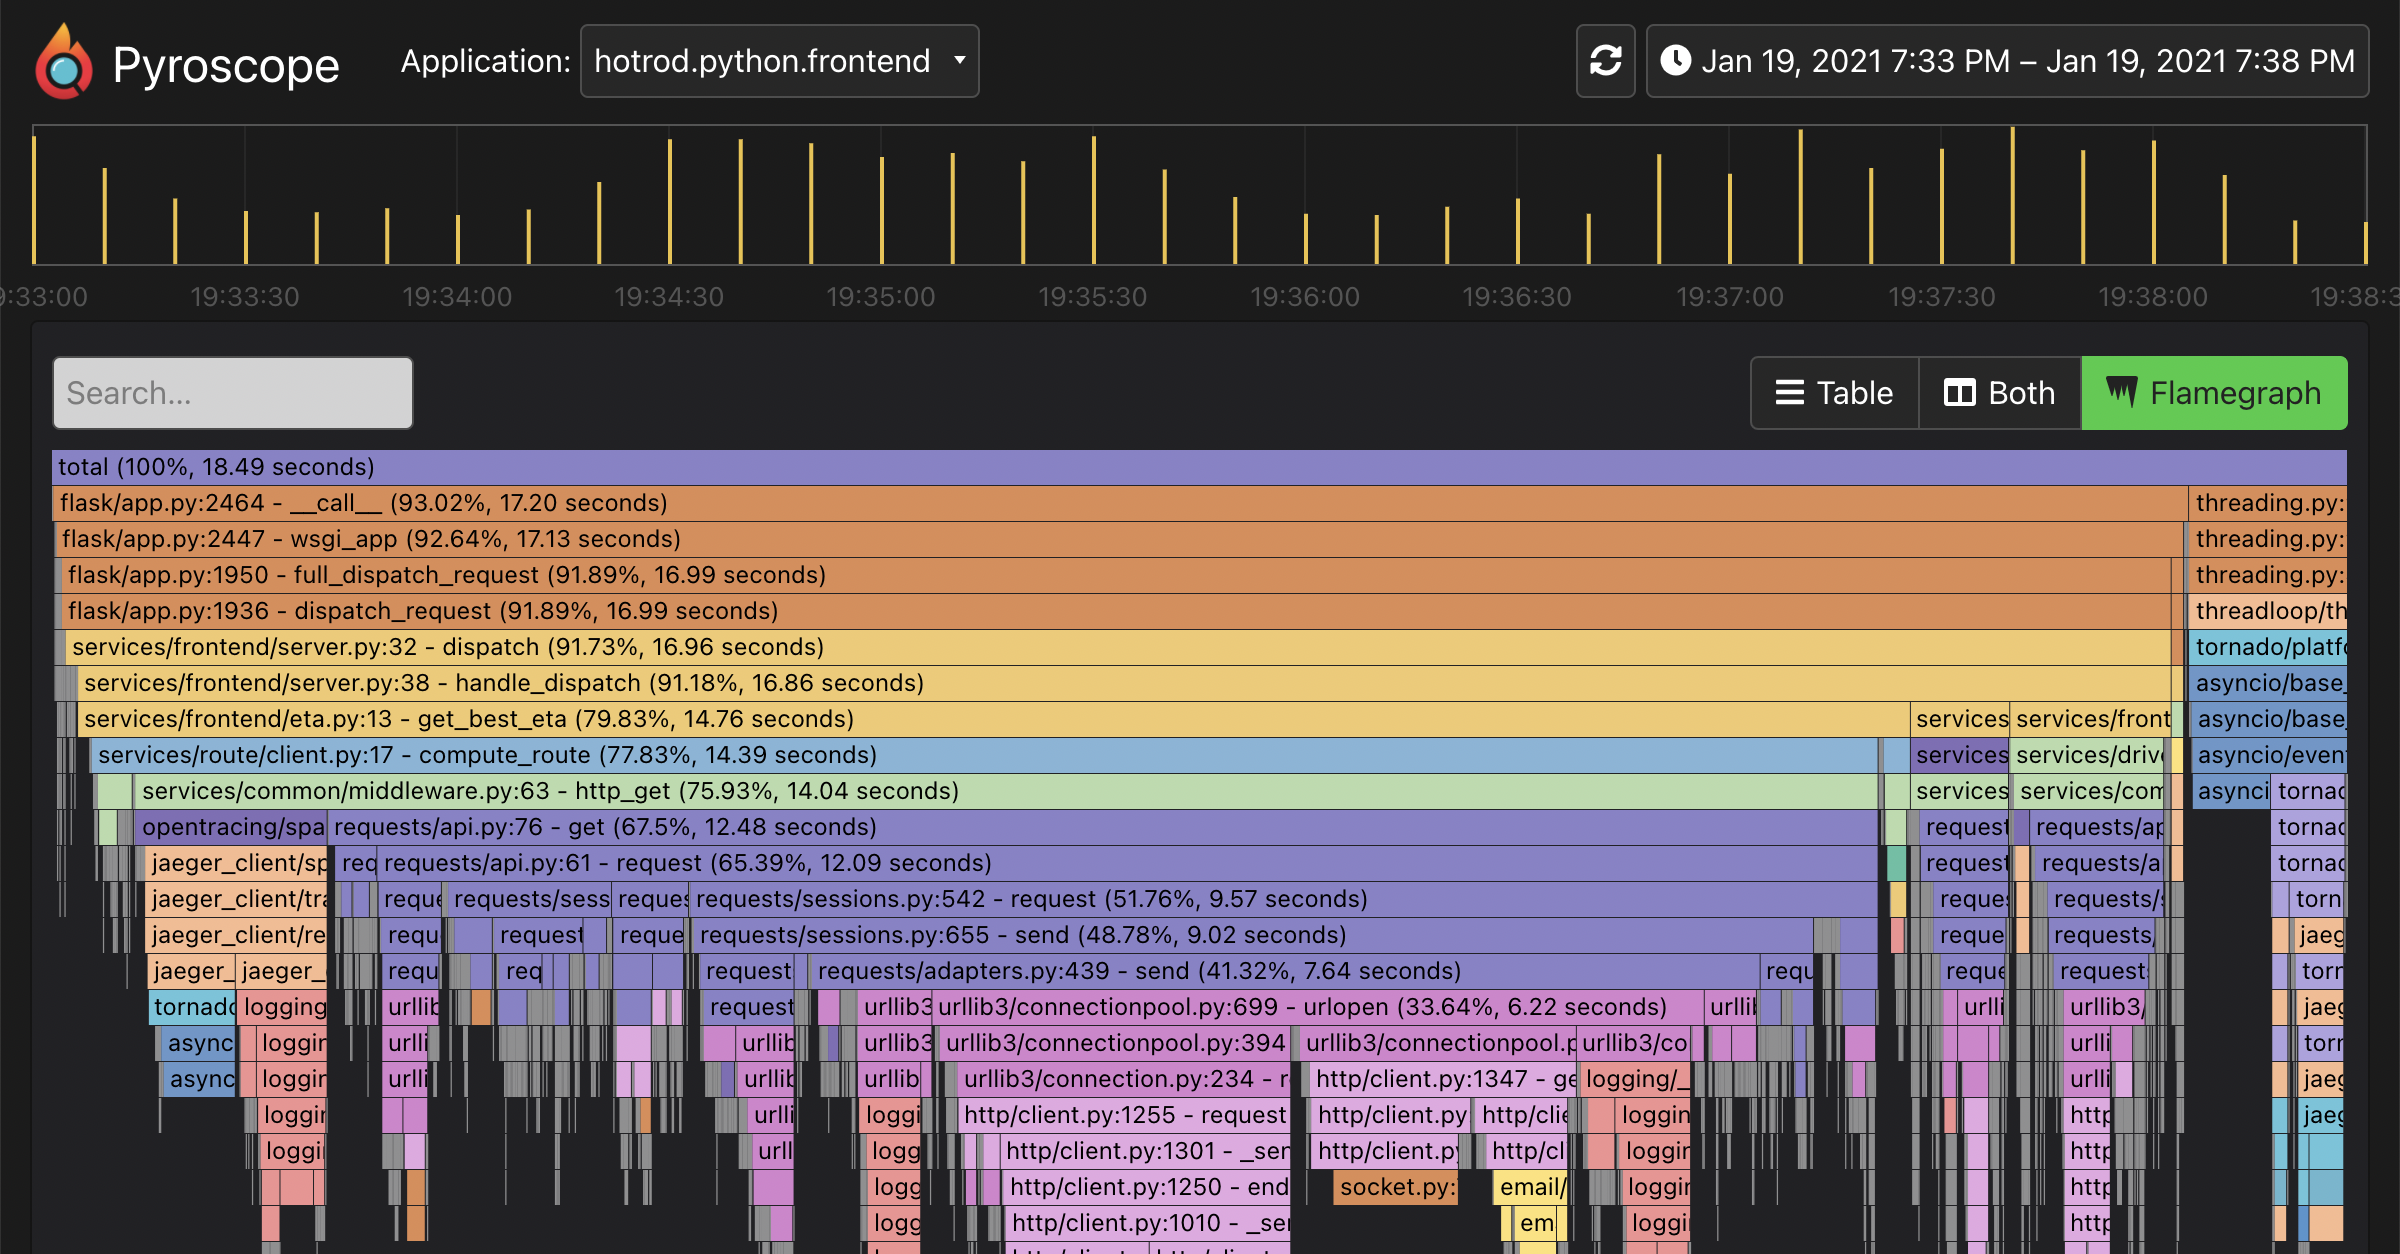
11- Grafana Pyroscope
Grafana Pyroscope is an open-source continuous profiling platform that helps you optimize CPU, memory, and I/O usage. It combines a server, client SDKs, and an intuitive UI to surface performance insights.
You can use it proactively to reduce resource consumption or reactively to debug bottlenecks with line-level detail.
12- Hertzbeat
Apache HertzBeat is an AI-powered, open-source observability platform that unifies metrics and logs with centralized alerting, all agent-free. It combines collection, analysis, alerting, and notifications in one system. Prometheus-compatible with built-in AI features, HertzBeat monitors everything from databases to cloud-native services.
High-performance clustering and custom monitoring make it a complete observability solution.
13- Apache SkyWalking APM
Apache SkyWalking is an open-source APM system for cloud-native distributed architectures. It provides end-to-end distributed tracing, service topology analysis, and observability dashboards. Supports agents for Java, .NET, Node.js, Python, and more. Features eBPF-based monitoring for Kubernetes deployments with CPU and network profiling.
Apache SkyWalking's Features:
Distributed Tracing
- End-to-end distributed tracing
- Service topology analysis
- Service-centric observability and API dashboards
Language Support
- Agents for Java, .NET Core, PHP, NodeJS, Golang, Lua, Rust, C++, JavaScript, and Python
- Active development and maintenance across all agents
eBPF Capabilities
- Rover agent for Kubernetes monitoring
- CPU and network profiling powered by eBPF
Scalability
- Collects and analyzes over 100 billion telemetry data points from a single cluster
Telemetry Ecosystem Support
- Works with Zipkin, OpenTelemetry, Prometheus, Zabbix, and Fluentd
- Handles metrics, traces, and logs from mature ecosystems
Native APM Database
- BanyanDB observability database built specifically for telemetry data
Metrics Aggregation
- Native meter format support
- Processes OpenTelemetry, Telegraf, and Zabbix formats through script pipelines
Log Management
- Log formatting and metric extraction
- Various sampling policies via script pipelines
Alerting and Pipelines
- Service, deployment, and API-centric alarm rules
- Forward alerts and telemetry data to third-party tools
AI-Powered Analysis
- Machine learning for pattern recognition
- Automatic HTTP URI pattern identification
- Metric baseline calculation for intelligent alerting
- Enhanced anomaly detection
14- Nightingale
Nightingale is an open-source monitoring project focused on alerting. It connects to existing data sources like VictoriaMetrics and ElasticSearch. Features include flexible alert rules, 20+ notification channels, edge deployment support, and an MCP server for AI-powered natural language alert management.
The Bottom Line
Observability isn't about adding complexity. It's about removing guesswork.
It's the difference between reacting to problems and understanding them. Between frustrating your clients and delighting them. Between burning hours on debugging and spending that time building features that actually matter.
If you're building applications that people rely on, you need to know what's happening inside them. Not sometimes. Not when something breaks. Always.
That's what observability gives you.