Business Intelligence
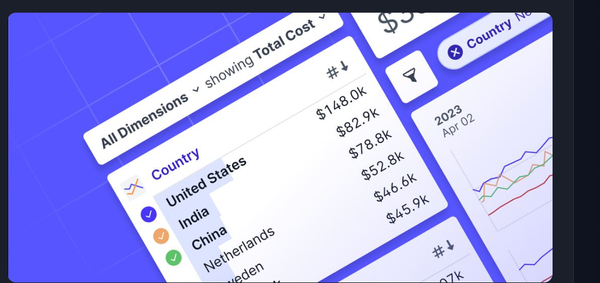
Rill - Create Interactive Data Dashboard with only SQL Built by Business Intelligence Geeks for Geeks
Rill is a tool for effortlessly transforming data sets into powerful, opinionated dashboards using SQL. BI-as-code.

Business Intelligence
Rill is a tool for effortlessly transforming data sets into powerful, opinionated dashboards using SQL. BI-as-code.
data science
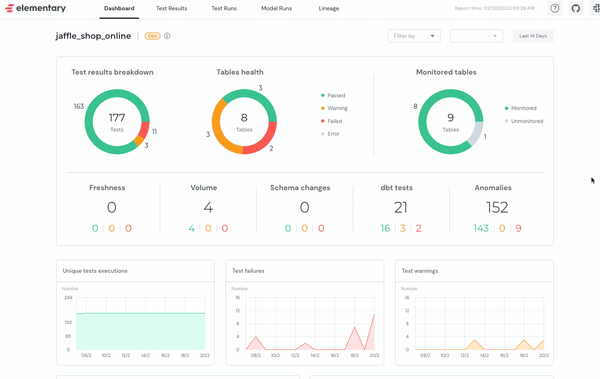
If you're a data engineer or data scientist, you understand the importance of a robust data observability tool. Enter Elementary, a native data observability solution designed specifically for data and analytics engineers. It's not just a tool, it's a comprehensive platform that integrates seamlessly
List
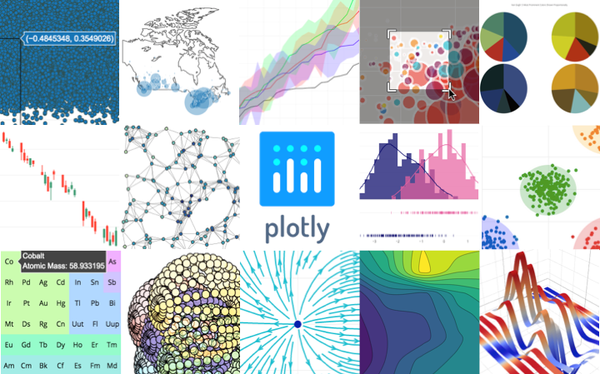
Welcome to an exhaustive list of over 30 data visualization libraries, frameworks, and applications. These tools span across a myriad of platforms and programming languages, providing you with the capability to present complex data in visually appealing and accessible ways. These solutions cater to a wide range of needs, whether
Self-hosted
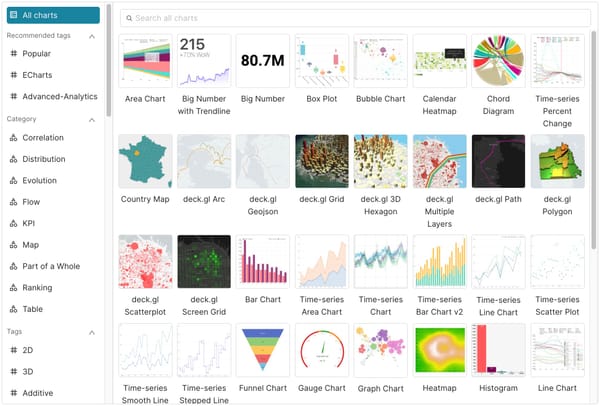
Apache Superset™ is an open-source modern data exploration and visualization platform.

List
What is a Data Dashboard A data dashboard for business intelligence is a powerful tool that enables organizations to make sense of their data and gain valuable insights. It provides a visual representation of key metrics, trends, and performance indicators, allowing users to monitor and analyze data in real-time. Benefits
data science
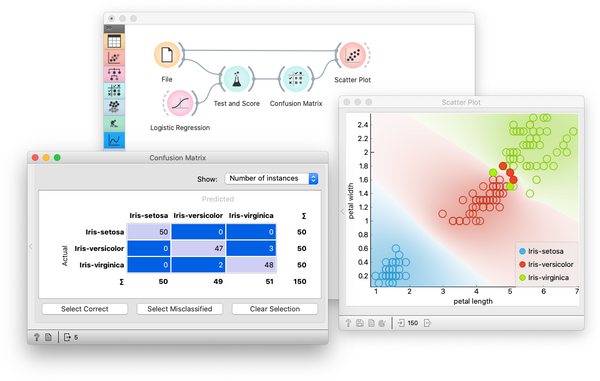
Orange is a powerful and user-friendly data mining and visualization toolbox designed for both beginners and experienced users. With Orange, you can easily explore and analyze your data without the need for any programming skills or advanced mathematical knowledge. The primary goal of Orange is to make data science accessible

BI
Database visualization panels are powerful tools that allow users to visually explore and analyze data stored in databases. These panels provide an intuitive interface to interact with database data and present it in a visually appealing and easy-to-understand manner. Features * Data exploration: Database visualization panels enable users to explore large
BI
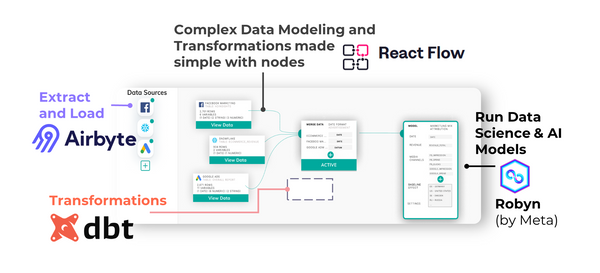
Kuwala is a data workspace that allows BI analysts and engineers to collaborate on building analytics workflows. It brings together data engineering tools like Airbyte, dbt, and Prefect into an intuitive interface. Kuwala emphasizes extendability, reproducibility, and enablement, empowering analysts and engineers to focus on their strengths. Key features include

no-code
Low-code and no-code are software development approaches that aim to simplify the process of building applications. These tools provide a visual interface and pre-built components, allowing users with limited programming knowledge, often referred to as citizen developers, to create software applications. Citizen developers are individuals who are not traditional programmers

BI
This is a small lightweight Python + JavaScript project that enables you to scrap Google Map leads in almost no time. Features 1. Scrape up to 1200 Google Map Leads in just 25 minutes, providing you with an extensive pool of potential customers to drive sales. 2. Access 30 Data Points,
data analysis
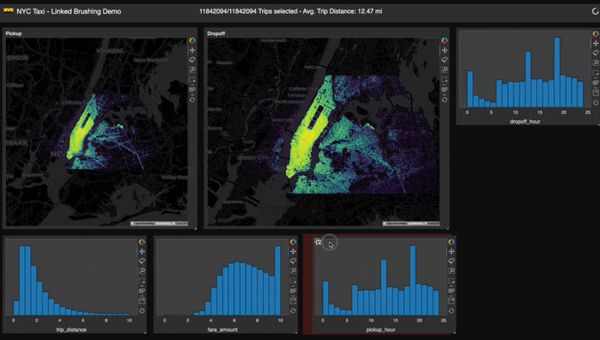
Panel is an open-source Python library that lets you easily build powerful tools, dashboards, and complex applications entirely in Python. It has a batteries-included philosophy, putting the PyData ecosystem, powerful data tables and much more at your fingertips. Features High-level reactive APIs and lower-level callback based APIs ensure you can

low-code
formsflow.ai is a low-code platform that helps build powerful business applications, quickly. It integrates open-source tools like form.io for forms, Camunda for workflows, Keycloak for security, and Redash for data analytics into a seamless and unified platform. Best of all, it's free!

data analysis
Helical Insight is a revolutionary open-source business intelligence framework that can help you gain insights from one or multiple data sources, making it a versatile tool for your business needs. It offers a wide range of features that you would expect from any BI tool, be it open source or
data science
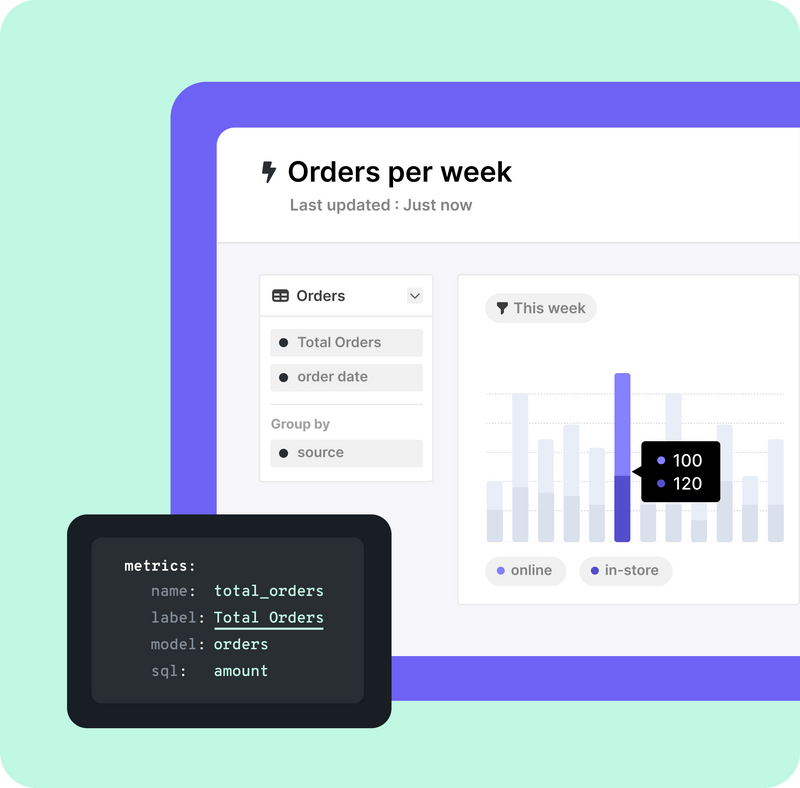
Lightdash instantly turns your dbt project into a full-stack BI platform. Analysts write metrics and Lightdash enables self-serve for the entire business.
BI
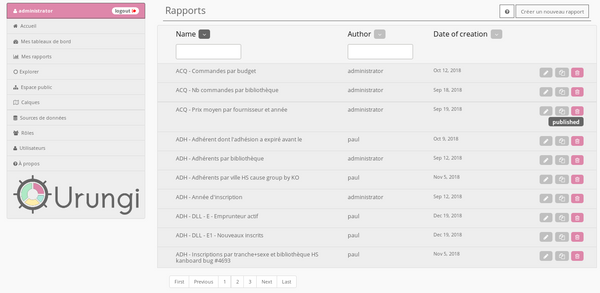
Urungi is a powerful tool that is designed to help you easily create and manage statistics and dashboards, no matter where your data comes from. With Urungi, you can take advantage of a range of features that will help you get the most out of your data. To begin with,
RAD
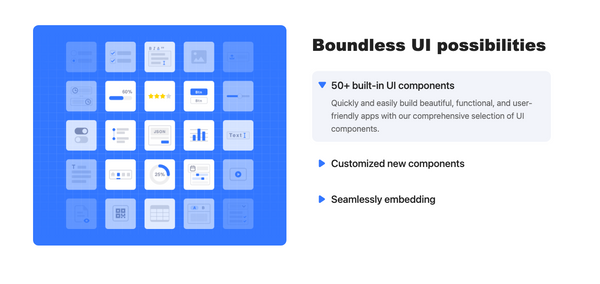
OpenBlocks is an innovative platform that allows users to create applications with minimal coding knowledge. With OpenBlocks, users can easily develop and deploy applications using a low-code or no-code approach. OpenBlocks offers a wide range of features that make it easy for users to create applications quickly and efficiently. These
business
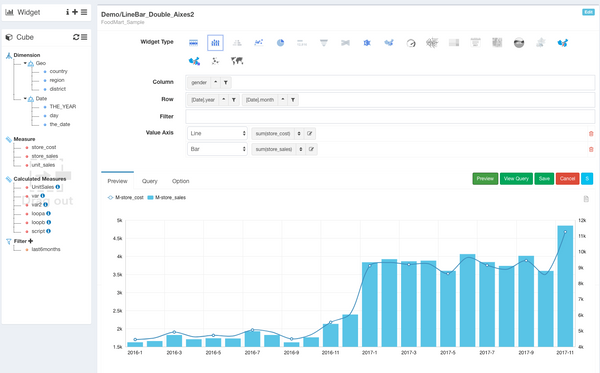
CBoard is a highly versatile analysis platform that provides a plethora of features to users who are looking to improve their data analysis capabilities. It is an interactive platform that allows users to design multi-dimensional reports with ease. Not only is it beneficial for normal users, but it is also