
Open-source
Qri is an Open-source Dataset Manager and Ogranizer
Qri CLI is a dataset version control system built on the distributed web

Open-source
Qri CLI is a dataset version control system built on the distributed web
mysql
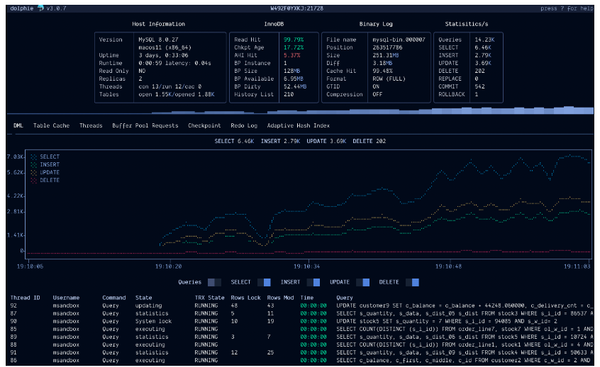
Dolphie is an incredibly powerful and user-friendly terminal tool that provides a multitude of features for monitoring MySQL in real-time. With its intuitive interface and comprehensive functionality, Dolphie allows users to effortlessly monitor and analyze their MySQL databases with ease. Using Dolphie, you can stay updated on the performance, status,
data
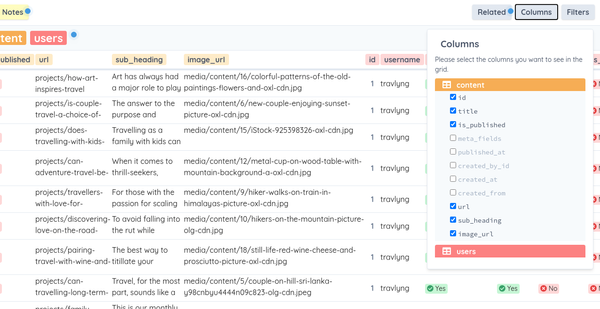
Manage Databases without knowing SQL. Track User growth, find Sales insights or bottlenecks, share KPIs without engineering.
data analysis
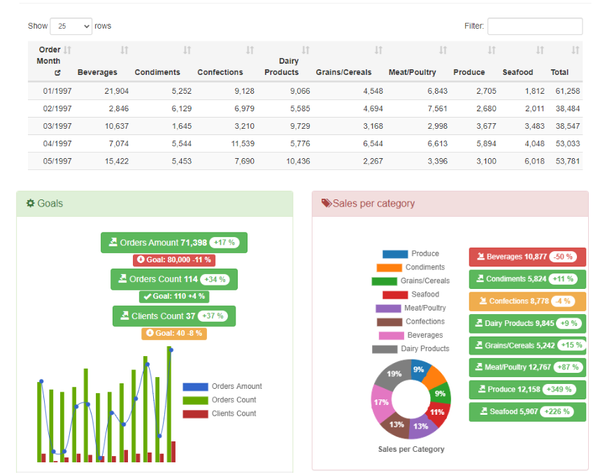
Seal Report is an open-source reporting tool for .NET that allows users to create and customize reports from various data sources. It offers a user-friendly interface, scheduling capabilities, and exporting options in different formats, making it ideal for data analysis and business intelligence. Features * Dynamic SQL sources: Use either your

Python
There are several reasons why you might need to convert JSON to CSV and vice versa in Python: 1. Data Transformation: JSON and CSV are two common formats for storing and exchanging data. Converting between them allows you to transform and manipulate data in different ways based on your needs.

Tutorials
In this tutorial, we will explore how to use Pandas to visualize data. We will cover various techniques and code snippets to create insightful visualizations. Let's dive in! 1- Import the necessary libraries: import pandas as pd import matplotlib.pyplot as plt 2- Load the data into a

code
To filter data using Pandas, one effective approach is to utilize boolean indexing. This powerful technique allows you to select rows from a DataFrame based on specific conditions. By applying boolean indexing, you can easily extract the desired subset of data that meets certain criteria. Below, I have provided some

Pandas
Pandas is a powerful open-source library for data manipulation and analysis in Python. It offers easy-to-use data structures and analysis tools, making it valuable for data scientists, analysts, and developers working with structured data. Install and start using Pandas Python Library for Data EngineeringPandas is a powerful and popular open-source

List
Open-source web scraping frameworks are software tools that provide a set of functionalities and APIs for extracting data from websites. They are typically used by developers, data scientists, and researchers to automate the process of gathering structured data from the web. Some common use cases for open-source web scraping frameworks
data science
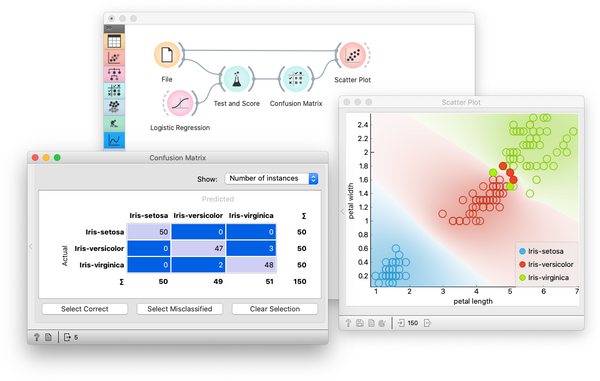
Orange is a powerful and user-friendly data mining and visualization toolbox designed for both beginners and experienced users. With Orange, you can easily explore and analyze your data without the need for any programming skills or advanced mathematical knowledge. The primary goal of Orange is to make data science accessible

data analysis
RATH is not only an open-source alternative to data analysis and visualization tools like Tableau, but it goes beyond that. It revolutionizes the exploratory data analysis workflow by leveraging its augmented analytic engine to automatically uncover patterns, insights, and causal relationships. Moreover, it takes these discoveries a step further by

BI
Database visualization panels are powerful tools that allow users to visually explore and analyze data stored in databases. These panels provide an intuitive interface to interact with database data and present it in a visually appealing and easy-to-understand manner. Features * Data exploration: Database visualization panels enable users to explore large