
LLM
Why Data Geeks Love These 16 Free AI Scraping Solutions
AI Scrapping Made Easy - 16 Open-source Free Solutions with LLMs support

LLM
AI Scrapping Made Easy - 16 Open-source Free Solutions with LLMs support

BioInformatics
The Python programming language plays a significant role in data science, AI, bioinformatics, web development, desktop applications, and game development. Python has gained popularity as an easy-to-learn language with a gentle learning curve and powerful frameworks. This has made it a favorite for university student projects and a common first
Python
Python is a top choice for building data applications due to its versatility, ease of use, and strong ecosystem of libraries. For data scientists and business developers, Python offers powerful tools for data analysis, machine learning, and data visualization, making it ideal for tackling complex data science projects and delivering
data science
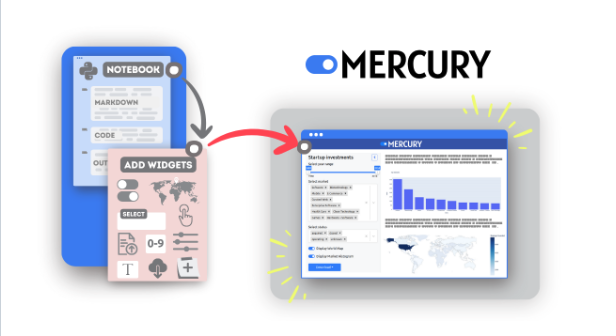
Mercury is a free and open-source app that allows you to add interactive widgets in Python notebooks, so you can share notebooks as web applications. Mercury offers a set of widgets with simple re-execution of cells. Features * Easy to use * add widgets with Python code - no frontend experience needed!

data science
Data engineering is the backbone of any data-driven project. With the right tools, you can streamline your data workflows, from collection and transformation to storage and retrieval. Julia, known for its high performance and ease of use, offers a plethora of packages tailored for data engineering tasks. Getting Started with

Tutorials
Data visualization is an essential aspect of data analysis, enabling you to understand and communicate your data's underlying patterns and insights. Julia offers several powerful packages for creating various types of visualizations, from basic plots to complex interactive charts. In this tutorial will introduce you to some of

data engineering
Exploring DIVA: A Deep Dive into Secure and Privacy-Aware Data Usage
Jupyter
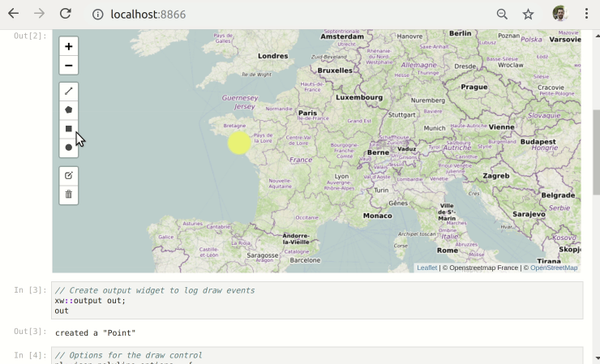
Voila is an open-source tool that converts Jupyter notebooks into interactive dashboards and web applications. It allows users to create dynamic interfaces using ipywidgets without needing front-end development skills. Voila executes code server-side, providing secure interactions with output only. It is compatible with JupyterHub, it supports multi-user environments and can

List
What is a Data warehouse Solution? A data warehouse solution is a centralized repository designed for the storage, analysis, and retrieval of large volumes of structured and unstructured data from multiple sources. It consolidates data from various operational systems, transforming it into a unified format to support business intelligence activities,
data science
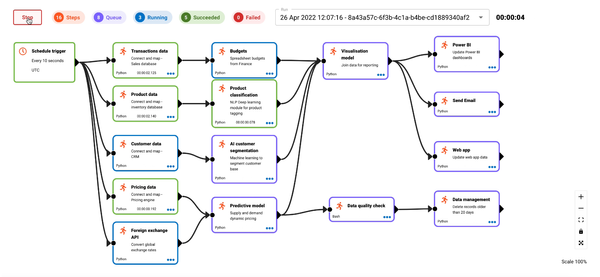
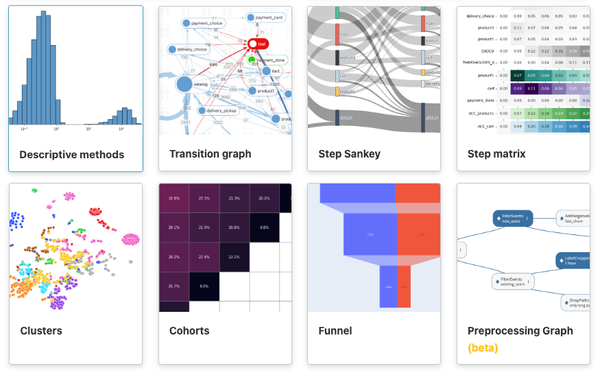
What is DataPlane? DataPlane is a high-performance software written in Golang, featuring a drag-drop data pipeline builder, built-in Python code editor, granular permissions for team collaboration, secrets management, a scheduler with multiple time zone support, and isolated environments for development, testing, and deployment. It also allows monitoring of real-time resource
data science
Welcome to our article about the best open-source self-hosted tools for data scientist and engineers. In this fascinating world of data, having the right tools at your disposal is crucial. From data cleaning to visualization, these open-source tools can make your life easier and enhance your workflow. 10 Reasons Why
data science
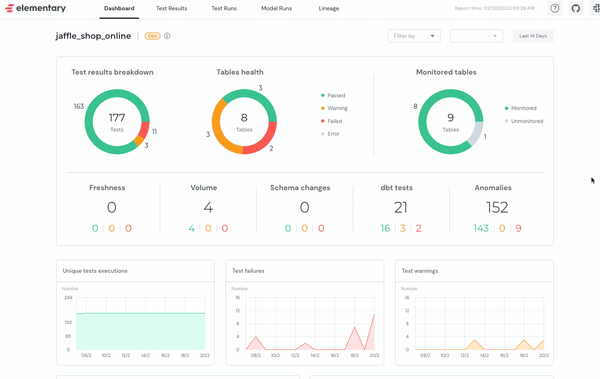
If you're a data engineer or data scientist, you understand the importance of a robust data observability tool. Enter Elementary, a native data observability solution designed specifically for data and analytics engineers. It's not just a tool, it's a comprehensive platform that integrates seamlessly
data science
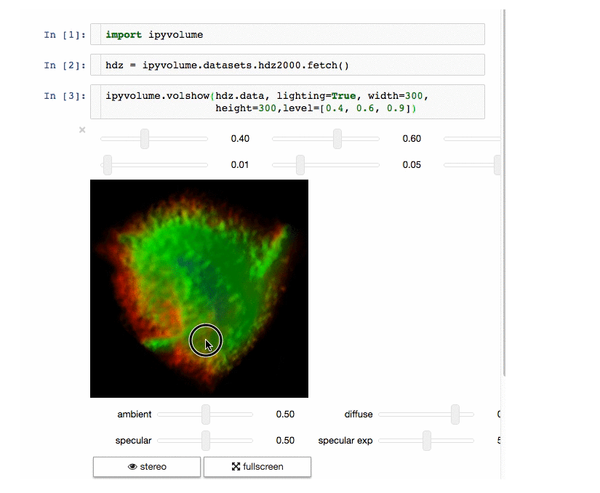
What is Ipyvolume? Ipyvolume is an innovative application designed for 3D plotting in Python, specifically within the Jupyter notebook environment. Using WebGL and IPython widgets, it provides a robust platform for visualizing complex data in three dimensions. Its capabilities include volume rendering, scatter plots, quiver plots, isosurface rendering, and lasso
List
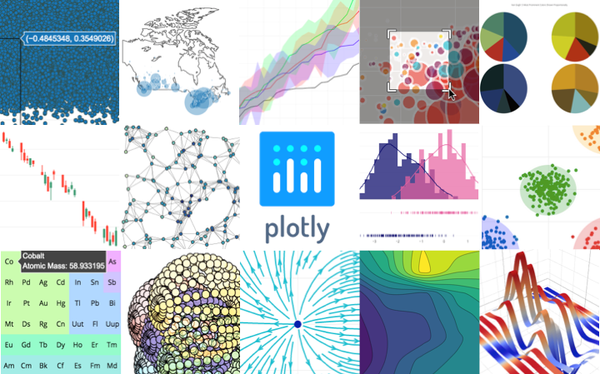
Welcome to an exhaustive list of over 30 data visualization libraries, frameworks, and applications. These tools span across a myriad of platforms and programming languages, providing you with the capability to present complex data in visually appealing and accessible ways. These solutions cater to a wide range of needs, whether

Python
Before we start, it is important to add the following Disclaimer by the project creators. Disclaimer for Google Maps Scraper Project This Google Maps Scraper is provided for educational and research purposes only. By using this Google Maps Scraper, you agree to comply with local and international laws regarding data
data engineering
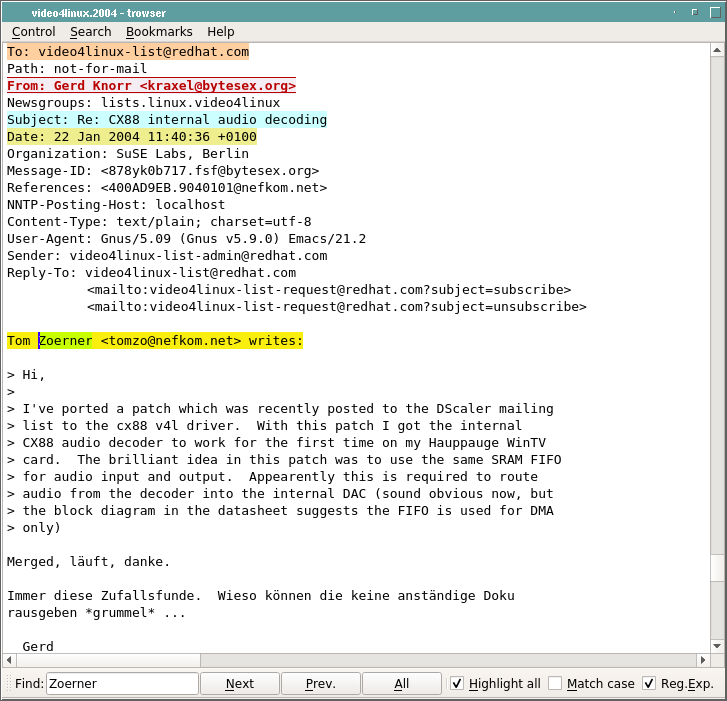
Trowser is a browser for large line-oriented text files, implemented in 3 alternate programming languages: Tcl/Tk, Python and C++/Qt. Compared to plain text viewers, trowser adds color highlighting, a persistent search history, graphical bookmarking and a separate search result window. The search window is especially designed to be

Big Data
Think of the term Big Data as a way to funnel multiple data streams into one medium in order to analyze it. And by analysis, we mean fishing out trends as well as insights. This isn’t a new concept; it’s been around since the 1950s and has been

Pandas
Pandas is an incredibly popular open-source data manipulation and analysis library for Python. It has gained immense popularity due to its ability to simplify complex data handling tasks. With Pandas, you can effortlessly work with various data structures and leverage a wide range of data analysis tools to manipulate and

List
What is a Data Dashboard A data dashboard for business intelligence is a powerful tool that enables organizations to make sense of their data and gain valuable insights. It provides a visual representation of key metrics, trends, and performance indicators, allowing users to monitor and analyze data in real-time. Benefits

List
What is a log file? A log file is a file that records events, actions, and system messages generated by various software applications, operating systems, or devices. It serves as a detailed record of activities and can be useful for troubleshooting, analysis, and auditing purposes. What is a log file

Open-source
Qri CLI is a dataset version control system built on the distributed web

Tutorials
In this tutorial, we will explore how to use Pandas to visualize data. We will cover various techniques and code snippets to create insightful visualizations. Let's dive in! 1- Import the necessary libraries: import pandas as pd import matplotlib.pyplot as plt 2- Load the data into a
data science
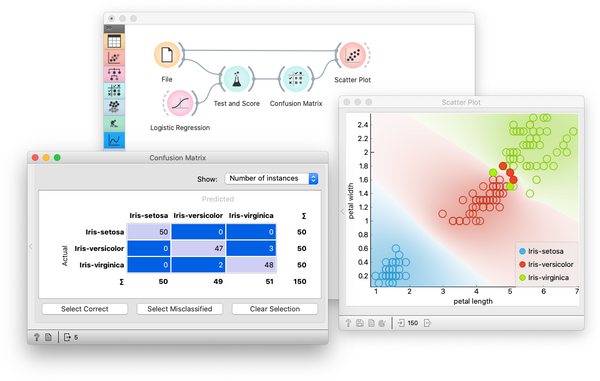
Orange is a powerful and user-friendly data mining and visualization toolbox designed for both beginners and experienced users. With Orange, you can easily explore and analyze your data without the need for any programming skills or advanced mathematical knowledge. The primary goal of Orange is to make data science accessible