Cloudflare Down? Why Single Points Fail and How Multi-Layer Open-source Uptime Monitoring Saves Your Business and Your Customers
Uptime Agent: Why You Should Never Ignore a Down Website, How to Actually Get Notified for Your Website, Backend Servers or Web Apps


Let’s be real, you’ve been there. You’re sipping coffee, checking your dashboard, and suddenly… nothing. Your site is down. Users are getting 500 errors. Emails are piling up. And you’re scrambling, wondering if it’s your fault. Well, It probably isn’t.
And for Developers or freelance developers to be exact, it is a disaster.
Last week, Cloudflare went dark for over 24 hours. Millions of websites, including major platforms, were unreachable. But here’s the kicker: most users didn’t know it was Cloudflare. They thought their servers were broken.
Their DNS failed. Their app crashed. The blame landed on their own infrastructure, when in reality, the entire internet pipeline had a critical failure.
That’s why uptime monitoring isn’t just a nice-to-have, it’s survival.
What Is Uptime Monitoring?
Uptime monitoring is the practice of continuously checking whether your website, API endpoint, webhook, or backend service is responding correctly, from multiple global locations, at regular intervals.
Uptime Agent: Why You Should Never Ignore a Down Website, How to Actually Get Notified for Your Website, Backend Servers or Web Apps
It’s not about “checking once a day.” It’s about knowing instantly when something breaks, before your customers do.
A good uptime agent does more than ping a URL. It basically do the following:
- Checks HTTP status codes (200 vs 500)
- Validates response content
- Monitors SSL certificates
- Tracks performance (response time, latency)
- Sends alerts via email, Slack, SMS, or Discord
- Records historical uptime stats (like a health report card)
Why You Need an Uptime Agent (Especially After Cloudflare’s Outage)
When Cloudflare went down, many teams panicked. They checked their servers, ran curl, restarted services, even deployed new instances, all while the real issue was outside their control.
But here’s the truth: you can’t rely on your own infrastructure to tell you when the world is broken.
You need an independent observer, a third-party Uptime Agent that lives outside your stack.
💡 If you're running a SaaS, e-commerce store, or any public-facing app, downtime = lost revenue, trust, and reputation.
We’ve run dozens of high-traffic websites, managed hundreds of self-hosted apps for clients, and built critical backend systems for startups. Every single one of them has faced outages, some due to our code, some due to AWS, some due to CDNs gone silent.
And every time, the first thing we did wasn’t debug, it was check the uptime monitor.
What Is a Self-Hosted Uptime & Server Monitoring Solution?
This is where open-source tools come in.
Unlike cloud-only platforms (looking at you, StatusCake, Pingdom), self-hosted uptime agents give you full control, privacy, and cost efficiency.
They run on your server, no vendor lock-in. No data leakage. No surprise bills.
You own the logs. You own the alerts. You own the truth.
Why We Recommend Open-Source Self-Hosted Solutions
We’ve tested, deployed, and maintained dozens of open-source uptime solutions — and here’s what makes them stand out:
| Feature | Why It Matters |
|---|---|
| Self-hosted | Your data never leaves your network. Perfect for compliance (HIPAA, GDPR, etc.). |
| Flexible monitoring | Track websites, REST APIs, GraphQL endpoints, Webhooks, TCP ports, SSH, databases. |
| Multiple alert channels | Slack, Email, Telegram, Discord, Webhook, Pushover, SMS — all configurable. |
| Geographic checks | Monitor from different regions (e.g., US, EU, Asia) to catch regional outages. |
| Low overhead | Lightweight. Runs on a Raspberry Pi or a $5/month VPS. |
| Extensible | Add custom scripts, integrate with CI/CD, build dashboards. |
Our Top Picks (Open-Source, Self-Hosted, Battle-Tested)
Here are the ones we actually use in production:
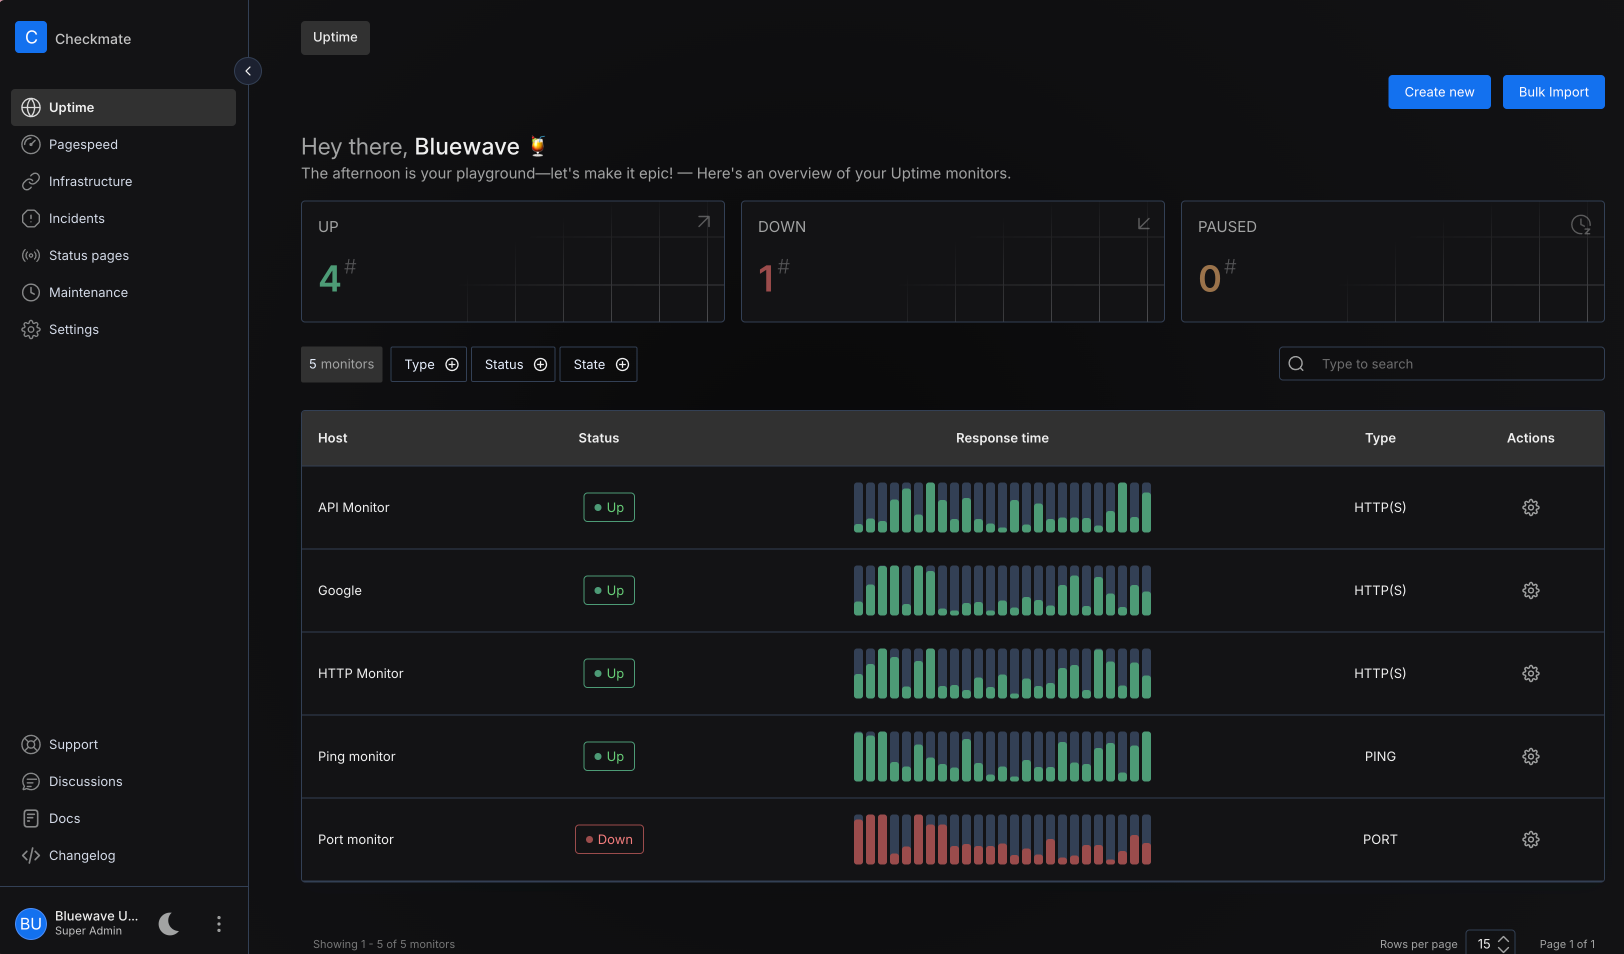
- Uptime Kuma
Simple, beautiful, web-based. Great for beginners. Supports HTTP, HTTPS, DNS, TCP, ping, and more. Real-time graphs. Mobile-friendly. - Prometheus + Alertmanager
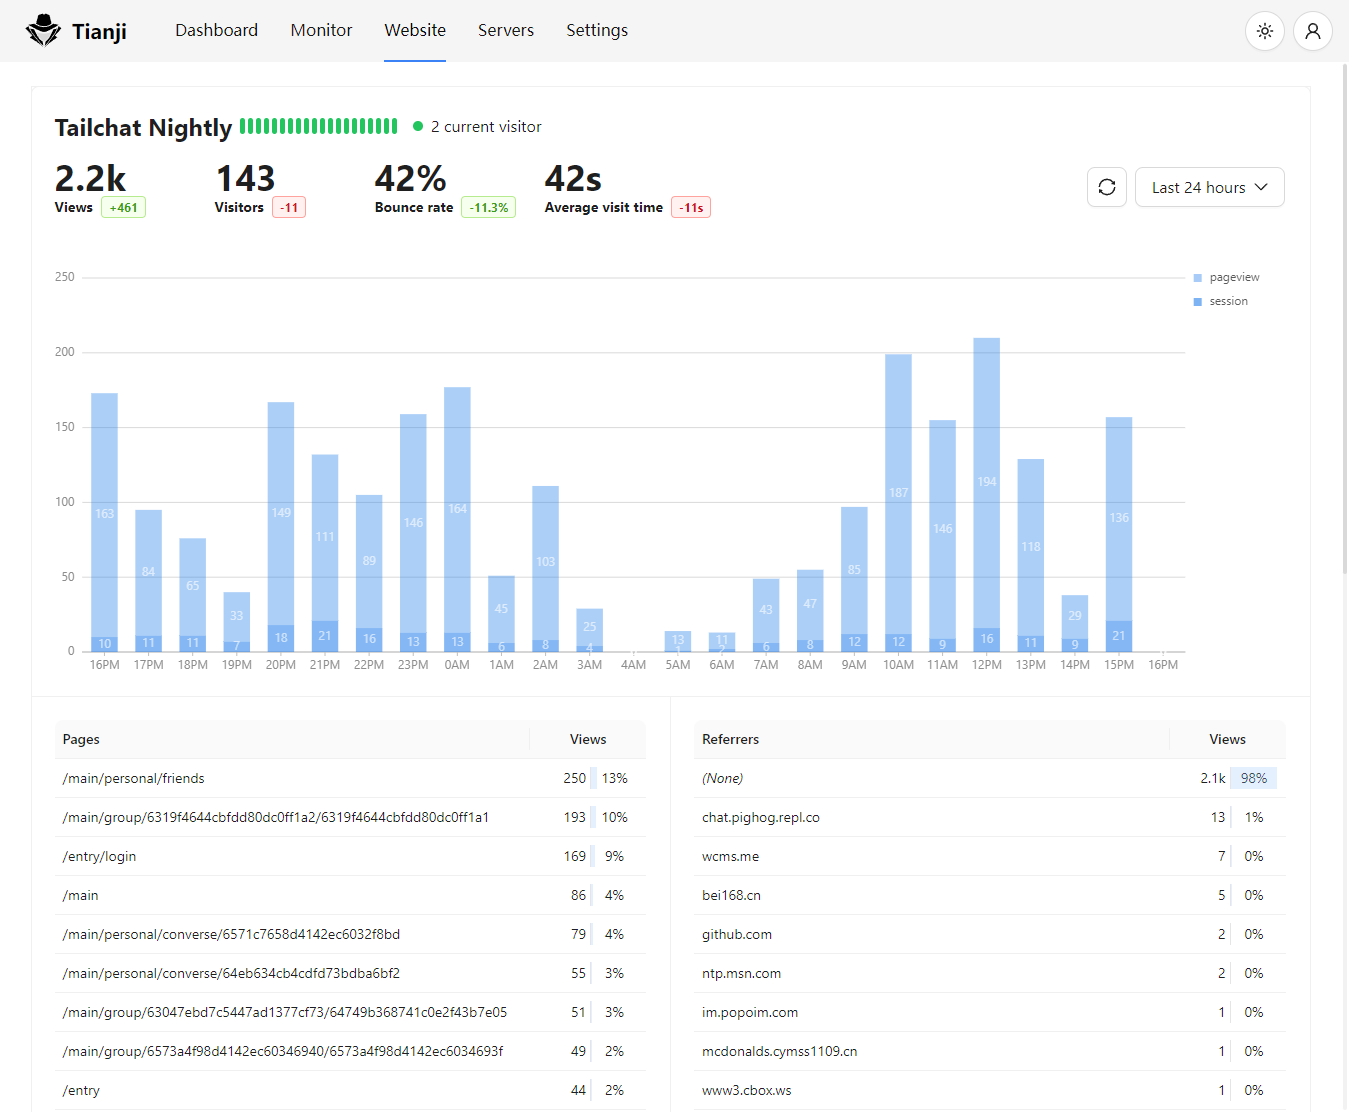
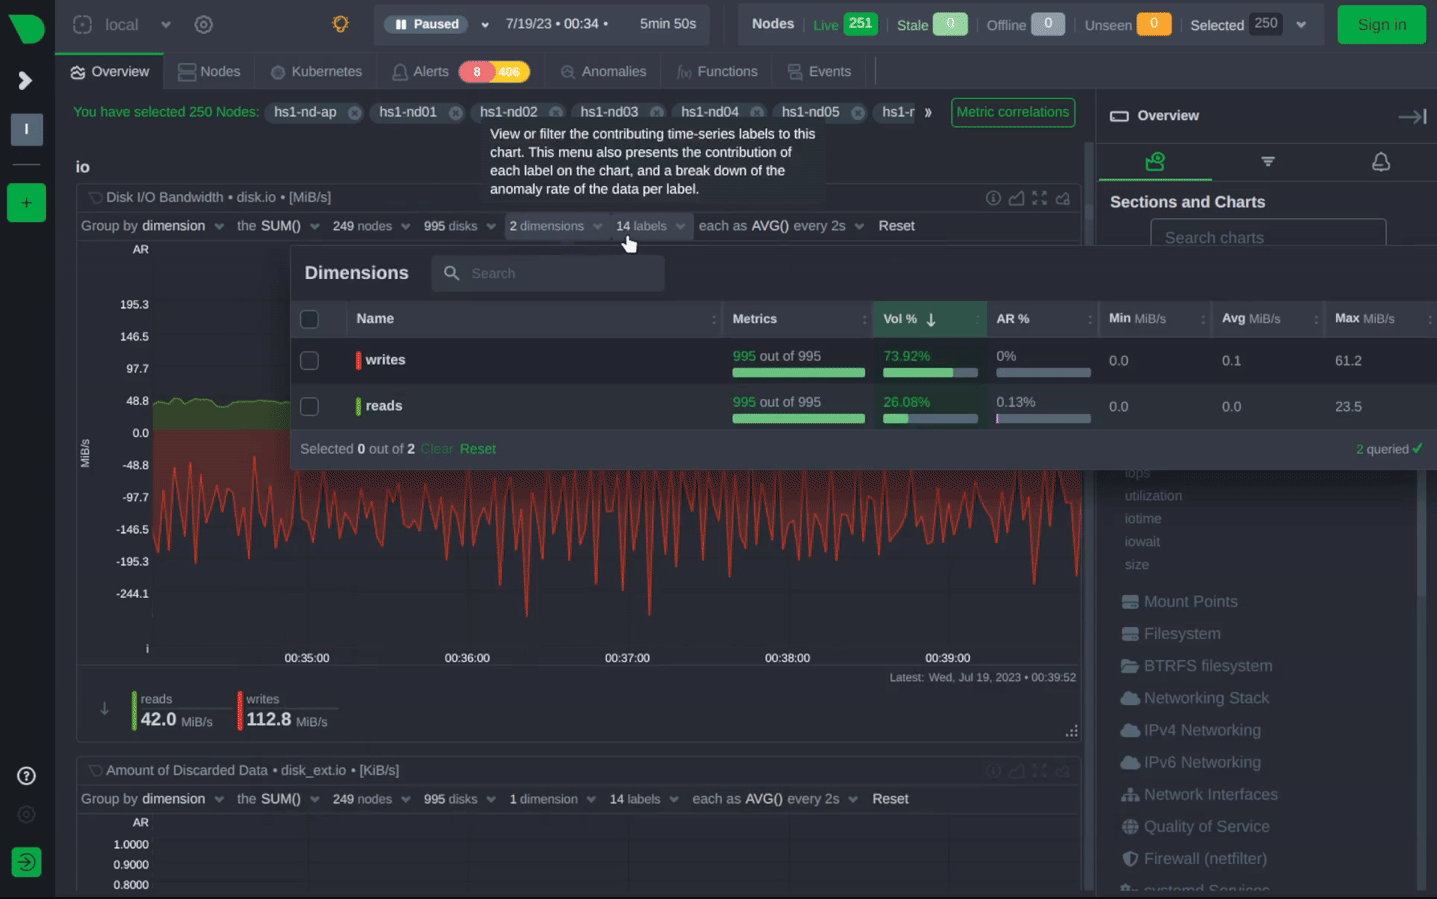
The gold standard for DevOps. Scalable, powerful, integrates with Grafana. Best for teams building complex observability stacks. - Netdata
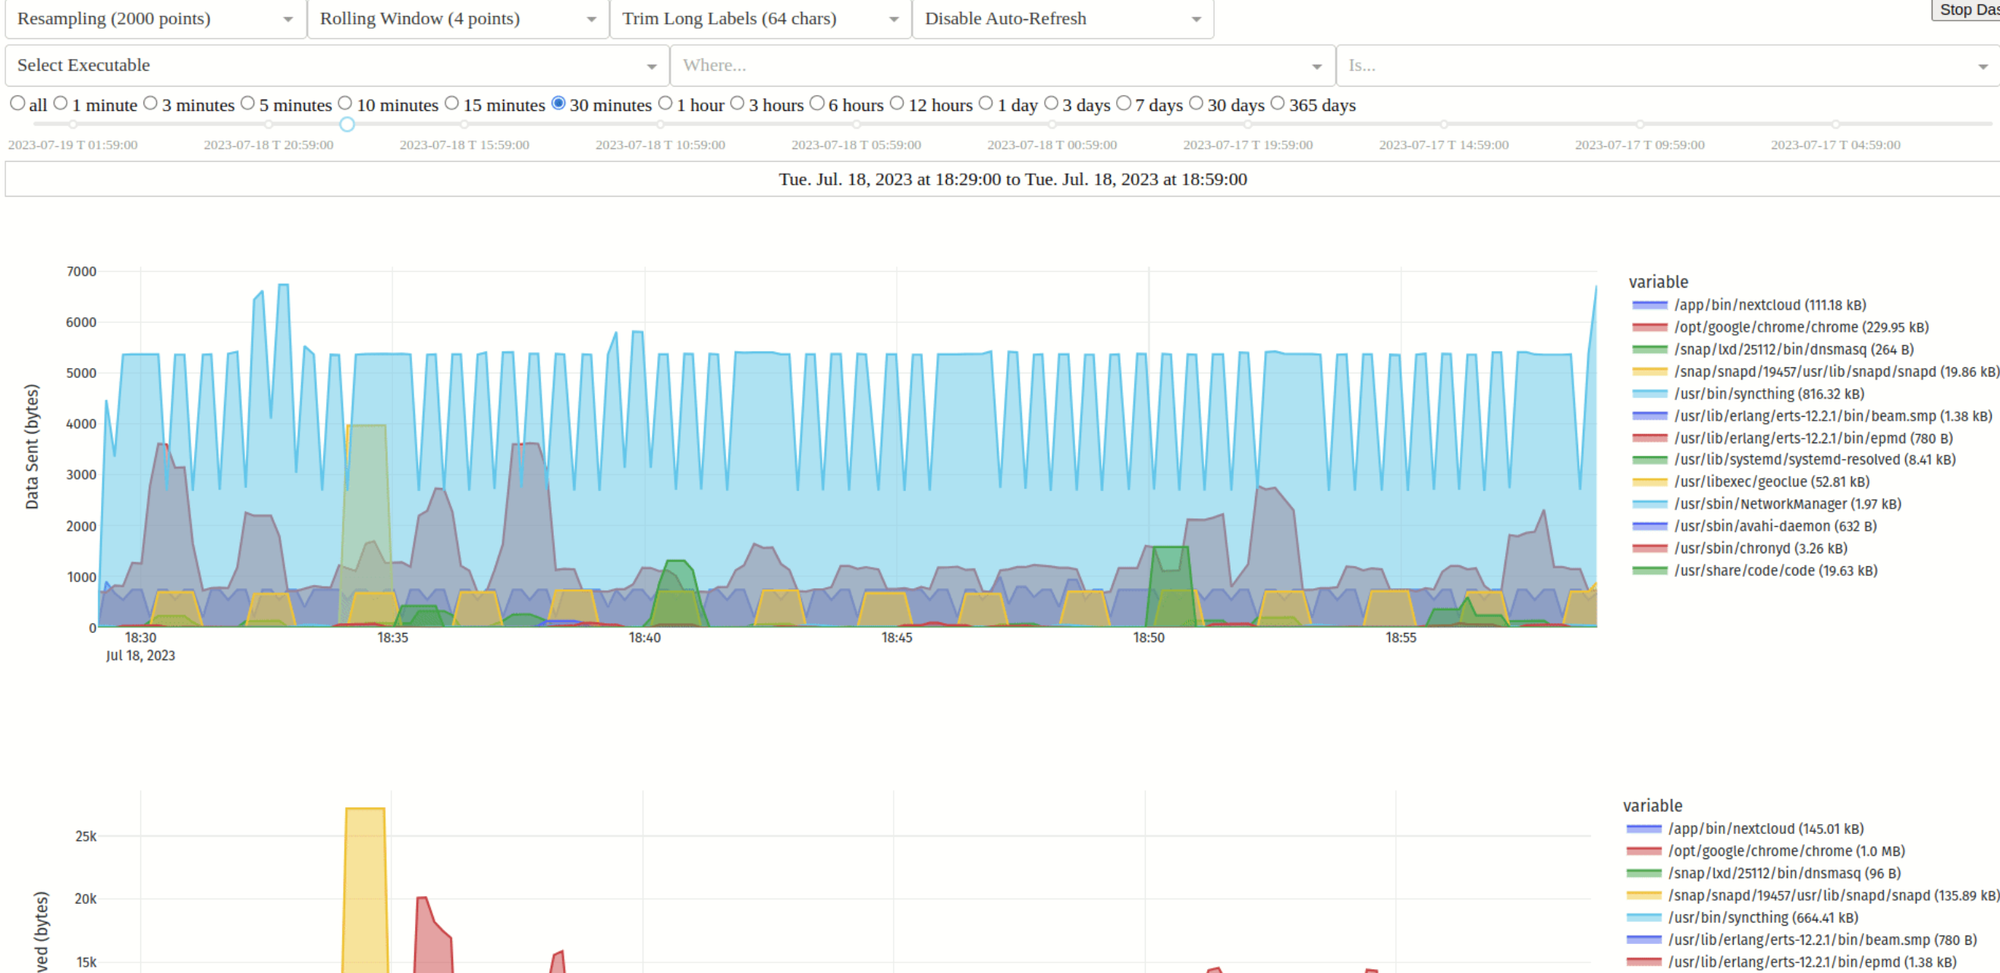
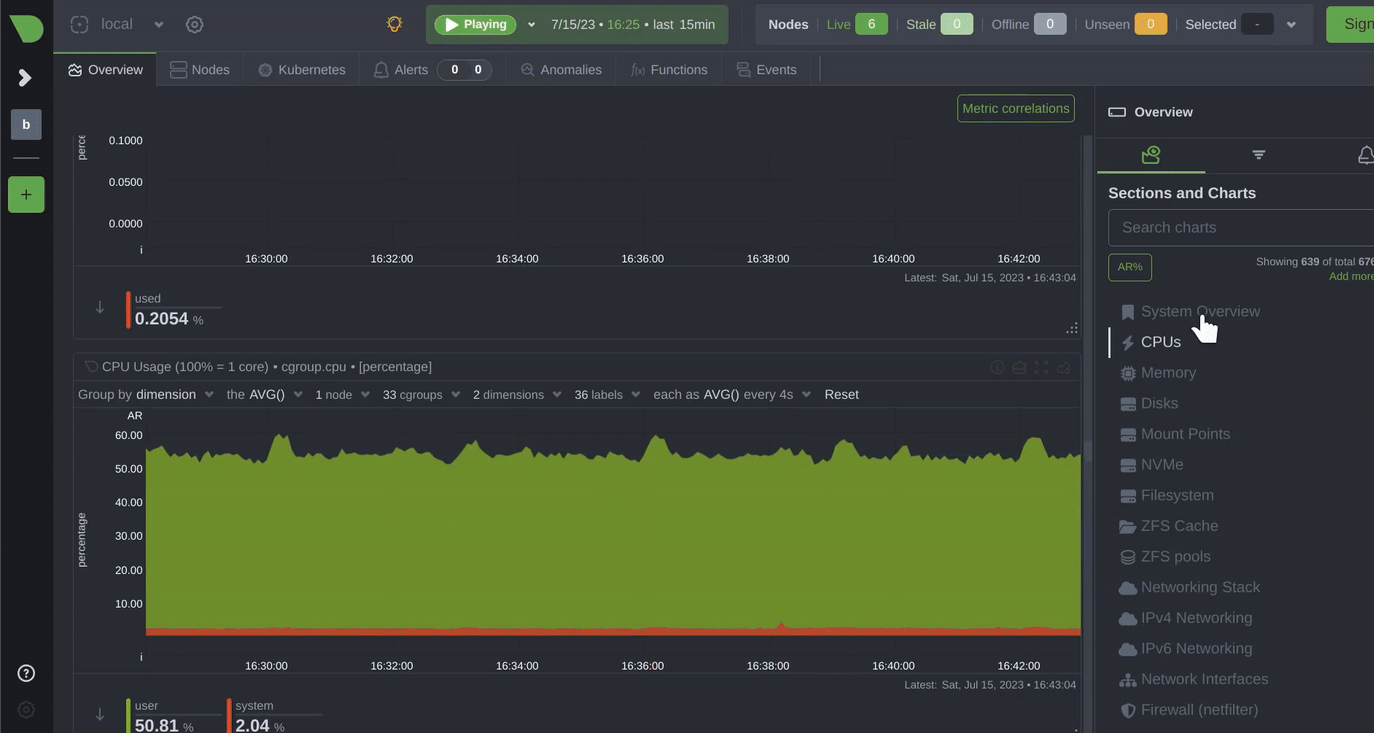
Real-time system monitoring. Tracks CPU, memory, disk, network, and even application-level metrics. Instant visibility into server health. - Sentry (with Uptime Plugin)
While known for error tracking, Sentry’s uptime monitoring plugin gives you deep insights into API reliability and service health. - Icinga 2
A rock-solid alternative to Nagios. Highly customizable, perfect for complex environments.
If you are looking for more, we got you covered by discovering, testing and trying dozens of server monitoring and self-hosted uptime monitors in Medevel.com, check the following articles:
Pro Tip: Monitor Your Own Monitoring
Yes, that’s a thing. I often do that. Set up a secondary monitor to watch your primary uptime tool. Because if your monitoring system goes down, you won’t know until it’s too late.
Use two tools. Or set up a cron job that pings your Uptime Kuma instance from a different server.
Final Note
You don’t need a fancy dashboard. You don’t need a $500/month plan.
You just need one simple truth:
If it’s not monitored, it’s assumed to be working. And when it breaks, you’ll be the last to know.
We’ve seen teams lose thousands of dollars because they didn’t have a single uptime check. So go install one today.
Whether you’re a developer, a website owner, or a DevOps engineer managing fleets of servers, get an Uptime Agent. Set it up. Turn on notifications. Sleep better at night.
Your users will thank you.
And when the next Cloudflare outage hits? You’ll know, before anyone else especially your customers.