18 Open-source Free SPSS Alternatives for Data and Statistical Analysis for 2024

SPSS is a proprietary commercial statistical software package. It enables statisticians and researchers to perform complex data analysis operations.
Even though SPSS is powerful, it has some issues. It's costly, so small groups or solo researchers might find it hard to afford. Also, its interface isn't as user-friendly as other stats software. Finally, while many people use SPSS, it isn't as flexible as free alternatives for customizing.
The same goes for Mathematica, which is an advanced modern technical computing system spanning all areas of technical computing—including, statistics, data analysis, neural networks, machine learning, image processing, geometry, data science, visualizations, and others.
You may be interested in our posts for data analysis:
 Hazem
Hazem Hazem
Hazem
In this post, we offer you the best open-source alternatives for SPSS, and Mathematica. (It is an updated post of our archived one)
1. R Language
R is a language and environment for statistical computing and graphics, similar to the S language. It offers a variety of statistical and graphical techniques, and is highly extensible. One of its strengths is the ease of producing publication-quality plots. R is available as Free Software under the GNU General Public License and runs on a variety of platforms.
It can compile and run on various UNIX platforms, Linux , Windows, and MacOS.
RStudio is an integrated development environment for R, offering a syntax-highlighting editor for direct code execution, tools for plotting, history, debugging, and workspace management. It simplifies the process of writing and debugging R code and can run the code directly from the editor.
RStudio is available in both open source and commercial editions, and can be run on a desktop or in a browser connected to RStudio Server or RStudio Server Pro.
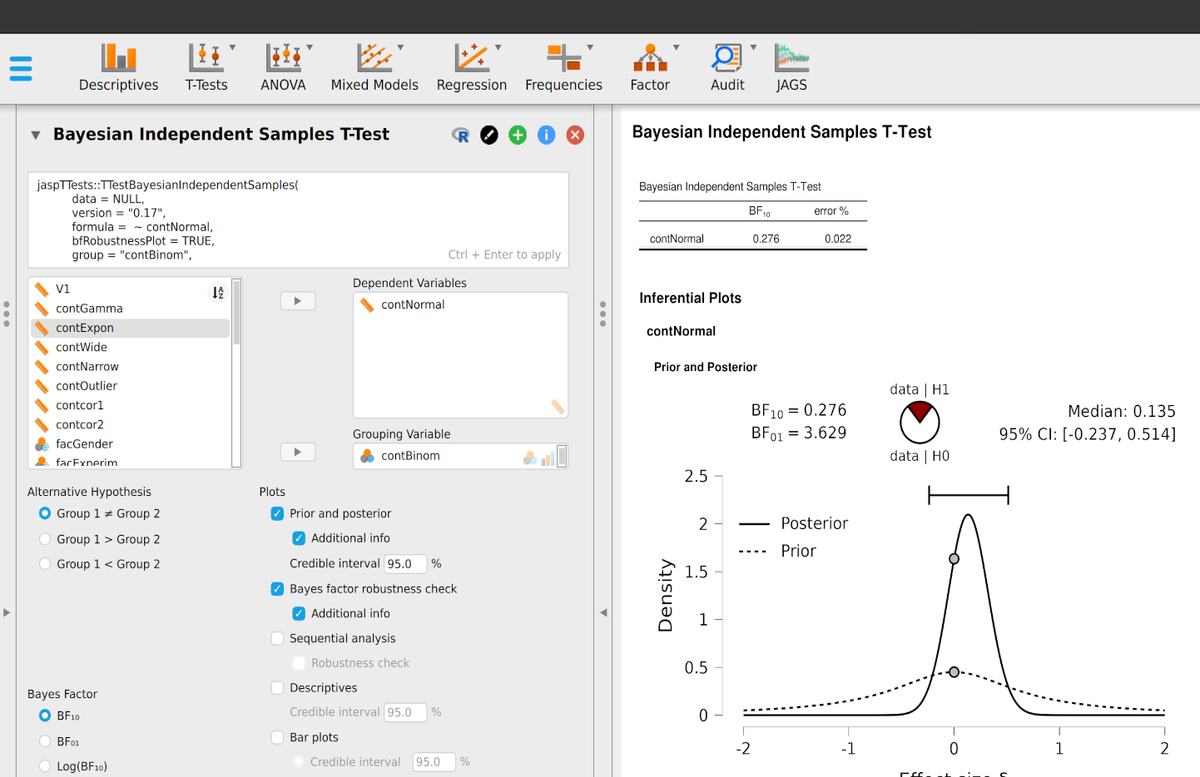
2. JASP
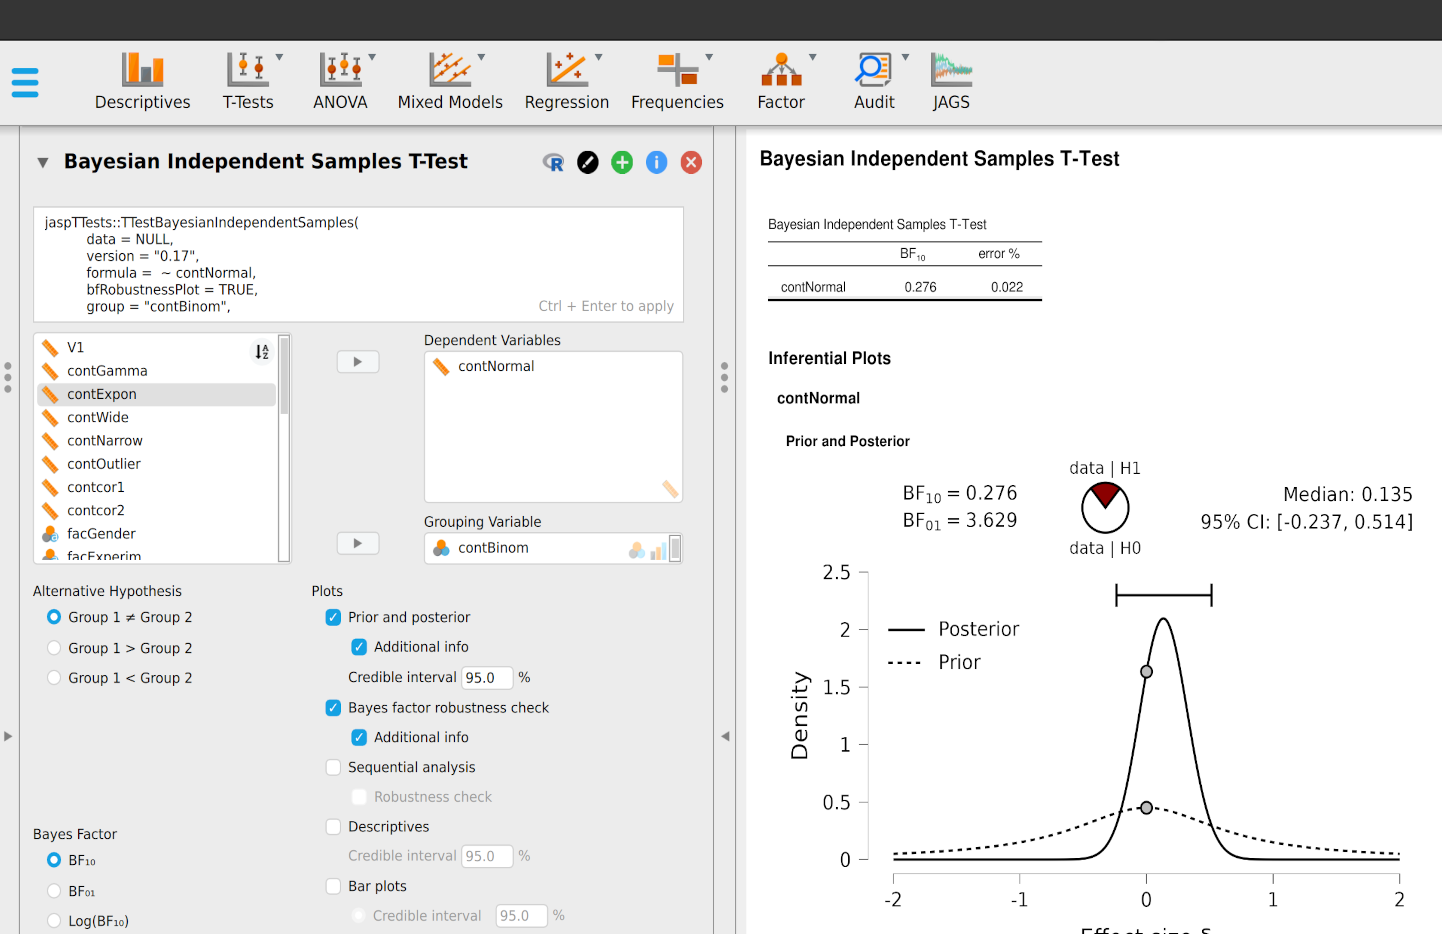
JASP is another alternative to SPSS. It is an open-source software for statistical analysis. Designed with the user in mind, JASP provides a rich set of statistical tests and is easy to use.
It allows users to conduct a variety of analyses including t-tests, ANOVA, regression analyses, and Bayesian statistics among others. JASP is a low barrier, easy-to-use alternative to R, making statistical analysis accessible to a broad audience without the need for programming knowledge.
Key Features
- Open-source software
- Provides a rich set of statistical tests
- Easy to use
- Allows various analyses including t-tests, ANOVA, regression analyses, and Bayesian statistics
- No need for programming knowledge
- Reads multiple formats: .csv, .txt, .tsv, .ods, .dta, .sav, .zsav, .por, .sas7bdat, .sas7bcat, .xpt and .jasp
- Includes numerous modules for both Frequentist and Bayesian analyses
Hazem
3. GNU PSPP
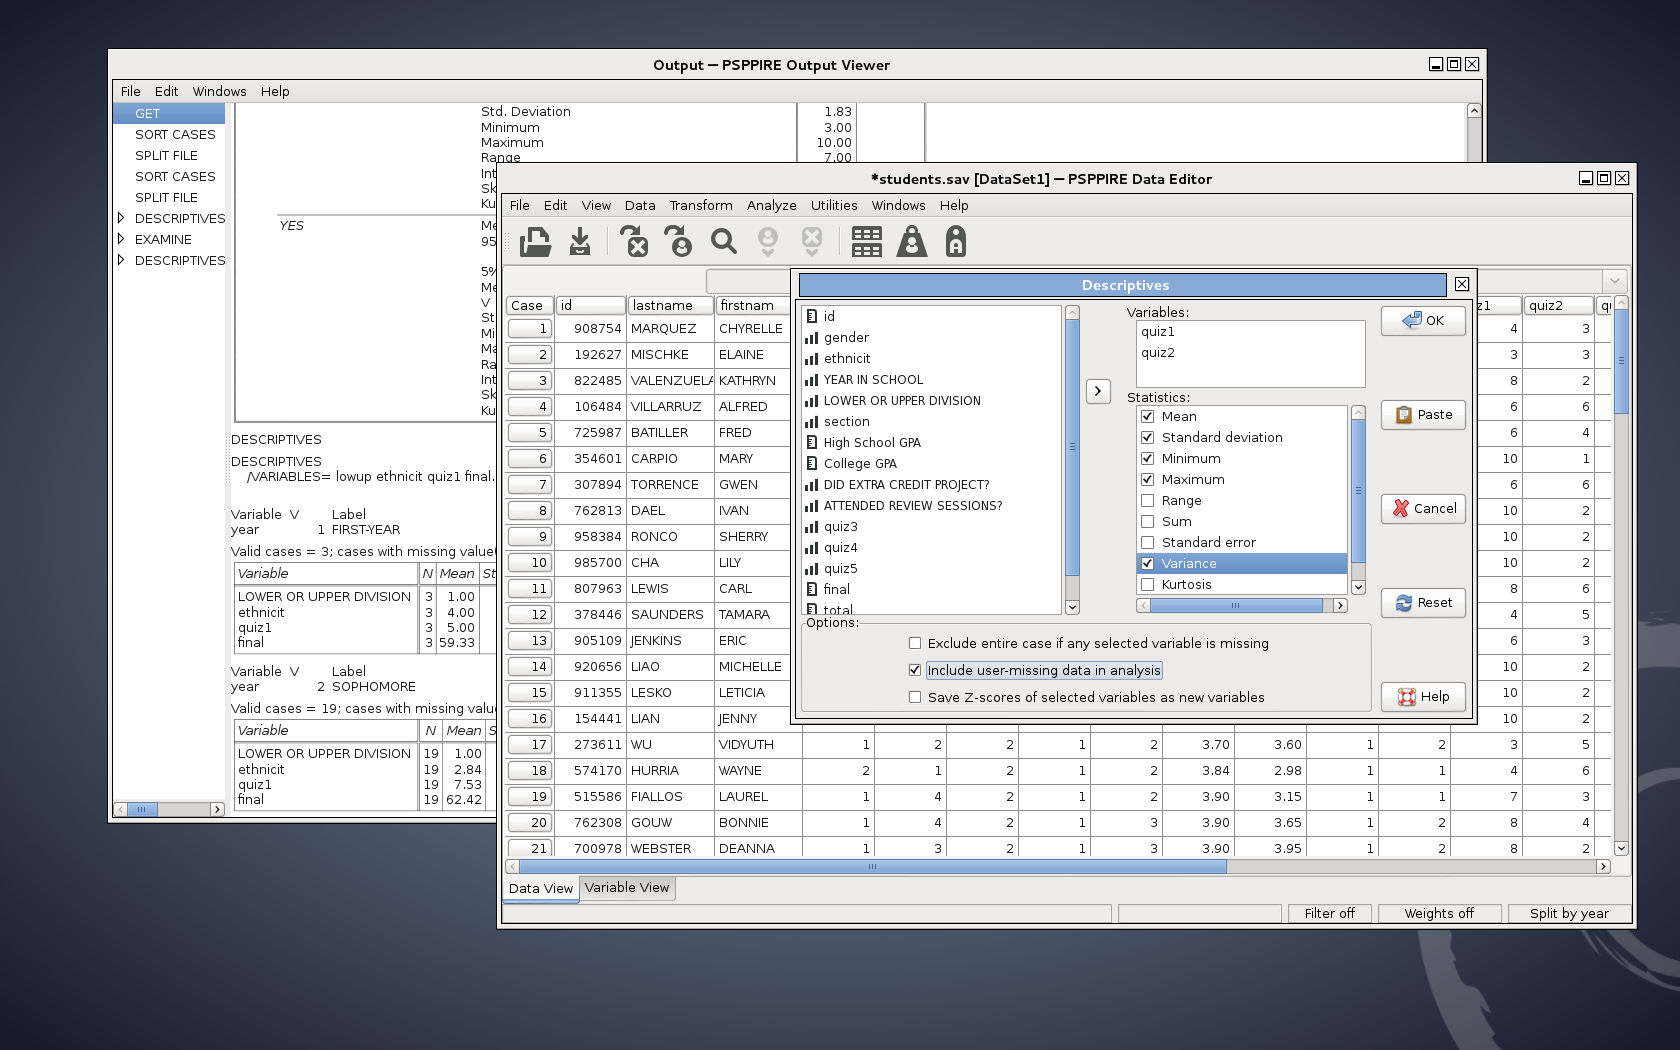
GNU PSPP is a free alternative to SPSS for statistical analysis of sampled data. It doesn't have "time bombs" or artificial limits on the number of cases or variables.
All functionalities are included in the core package without the need for additional purchases. PSPP can perform various statistical tests and analyses, and is designed for fast performance regardless of input data size. It can be used with a graphical interface or traditional syntax commands.
Features
- No artificial limits on the number of cases or variables
- No additional purchases required for advanced functions
- Can perform various statistical analyses
- Terminal Mode
- Support for over 1 billion cases and variables
- Compatible with SPSS syntax and data files
- Offers both terminal and graphical user interfaces
- Multiple output formats: text, postscript, pdf, opendocument, html
- Inter-operability with Gnumeric, LibreOffice, and other free software
- Easy data import from spreadsheets, text files, and database sources
- Can open, analyze, and edit multiple datasets concurrently
- Supports all common character sets
- User interface has been translated into multiple languages
- Fast statistical procedures, even with large data sets
- No license fees or expiration period
- No unethical "end user license agreements"
- Comes with a fully indexed user manual
- Licensed under the GPLv3 or later, ensuring freedom
- Portable across many different computers and operating systems
- Export to many formats
- Data visualization
- Rich math functions
Platforms
- Linux
- Debian
- Ubuntu
- Fedora
- Arch Linux
- Flatpak
- Windows
- macOS

 Hazem
Hazem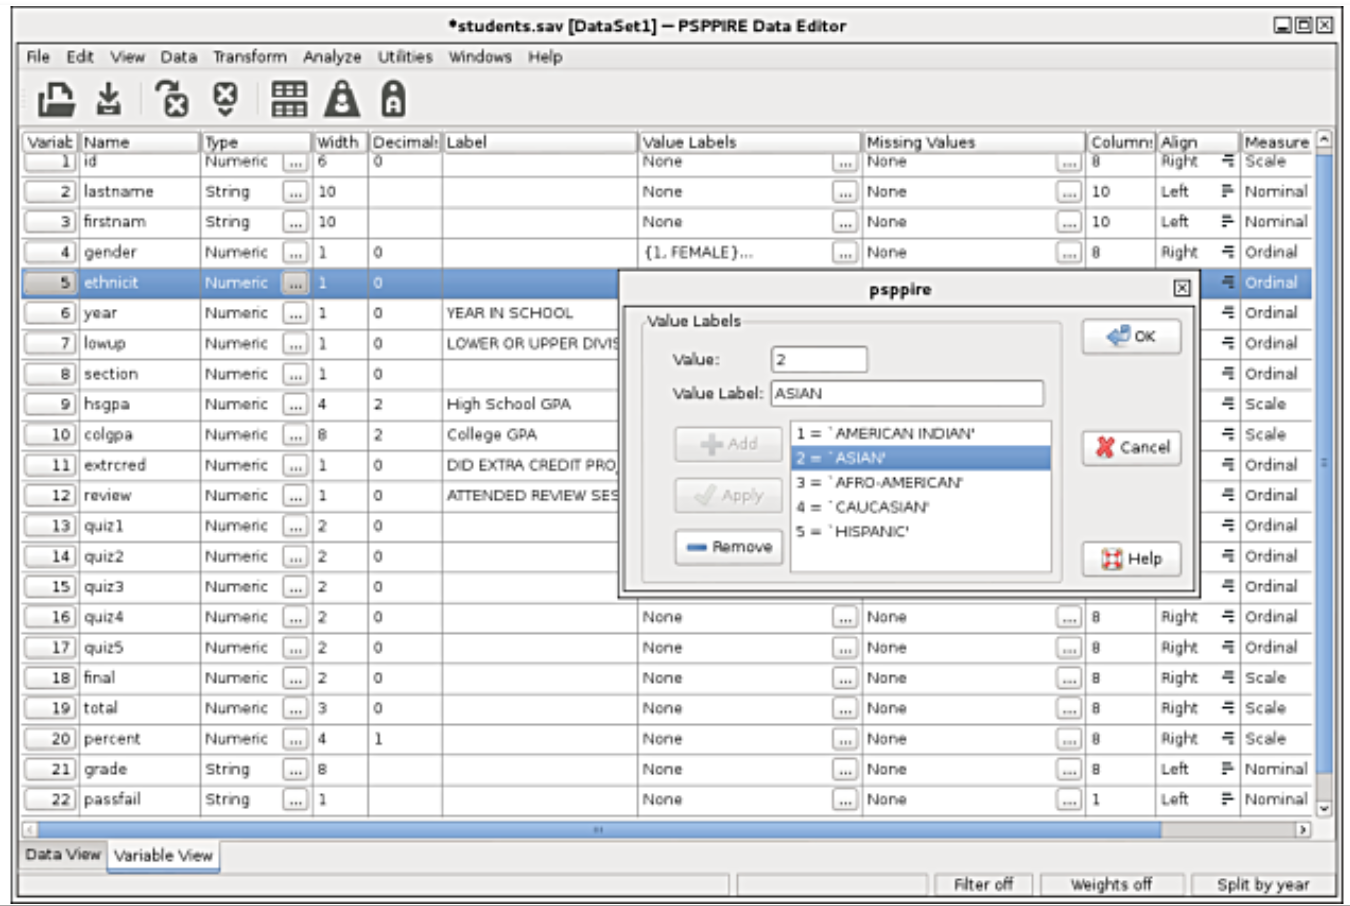
4. Jamovi
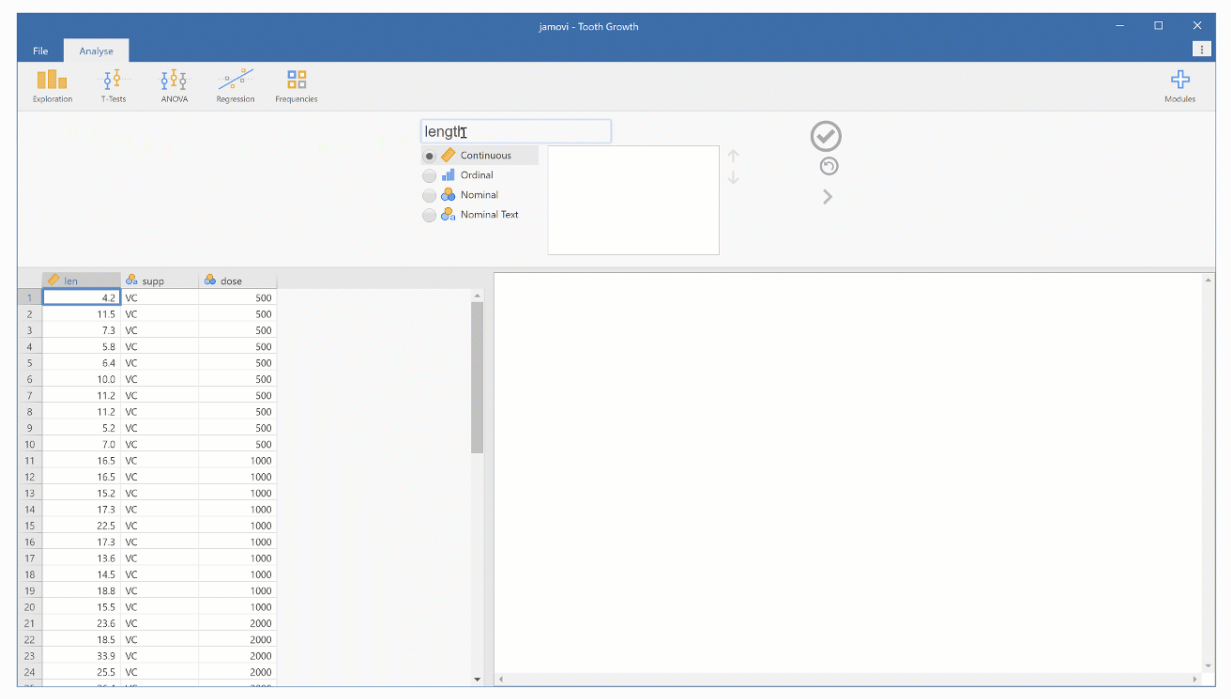
Jamovi, a third-generation statistical spreadsheet built on the R statistical language, serves as a cost-effective alternative to products like SPSS and SAS. It provides access to advanced statistical tools and can generate R code for analyses. As a product of the scientific community, it remains free and open.
It offers two editions, one for the cloud and the other for the desktop.
Key Features
- Built on the R statistical language
- Provides access to advanced statistical tools
- Can generate R code for analyses
- Free and open-source
- Provides a complete suite of analyses including t-tests, ANOVAs, correlation and regression, non-parametric tests, contingency tables, reliability and factor analysis
- Includes the jamovi library with additional analyses contributed by experts
- Fully functional spreadsheet optimized for statistical data
- Allows data entry, copy/pasting data, row filtering, computation of new values, and performing transforms across many columns
- Provides "syntax mode" for viewing and copying the underlying R syntax for each analysis
- Includes the Rj Editor for running R code directly inside jamovi
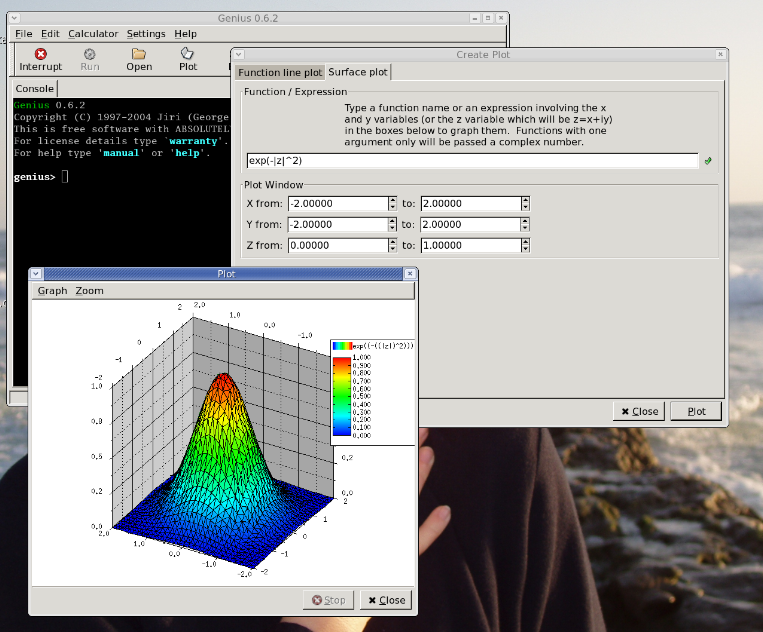
5. Genius
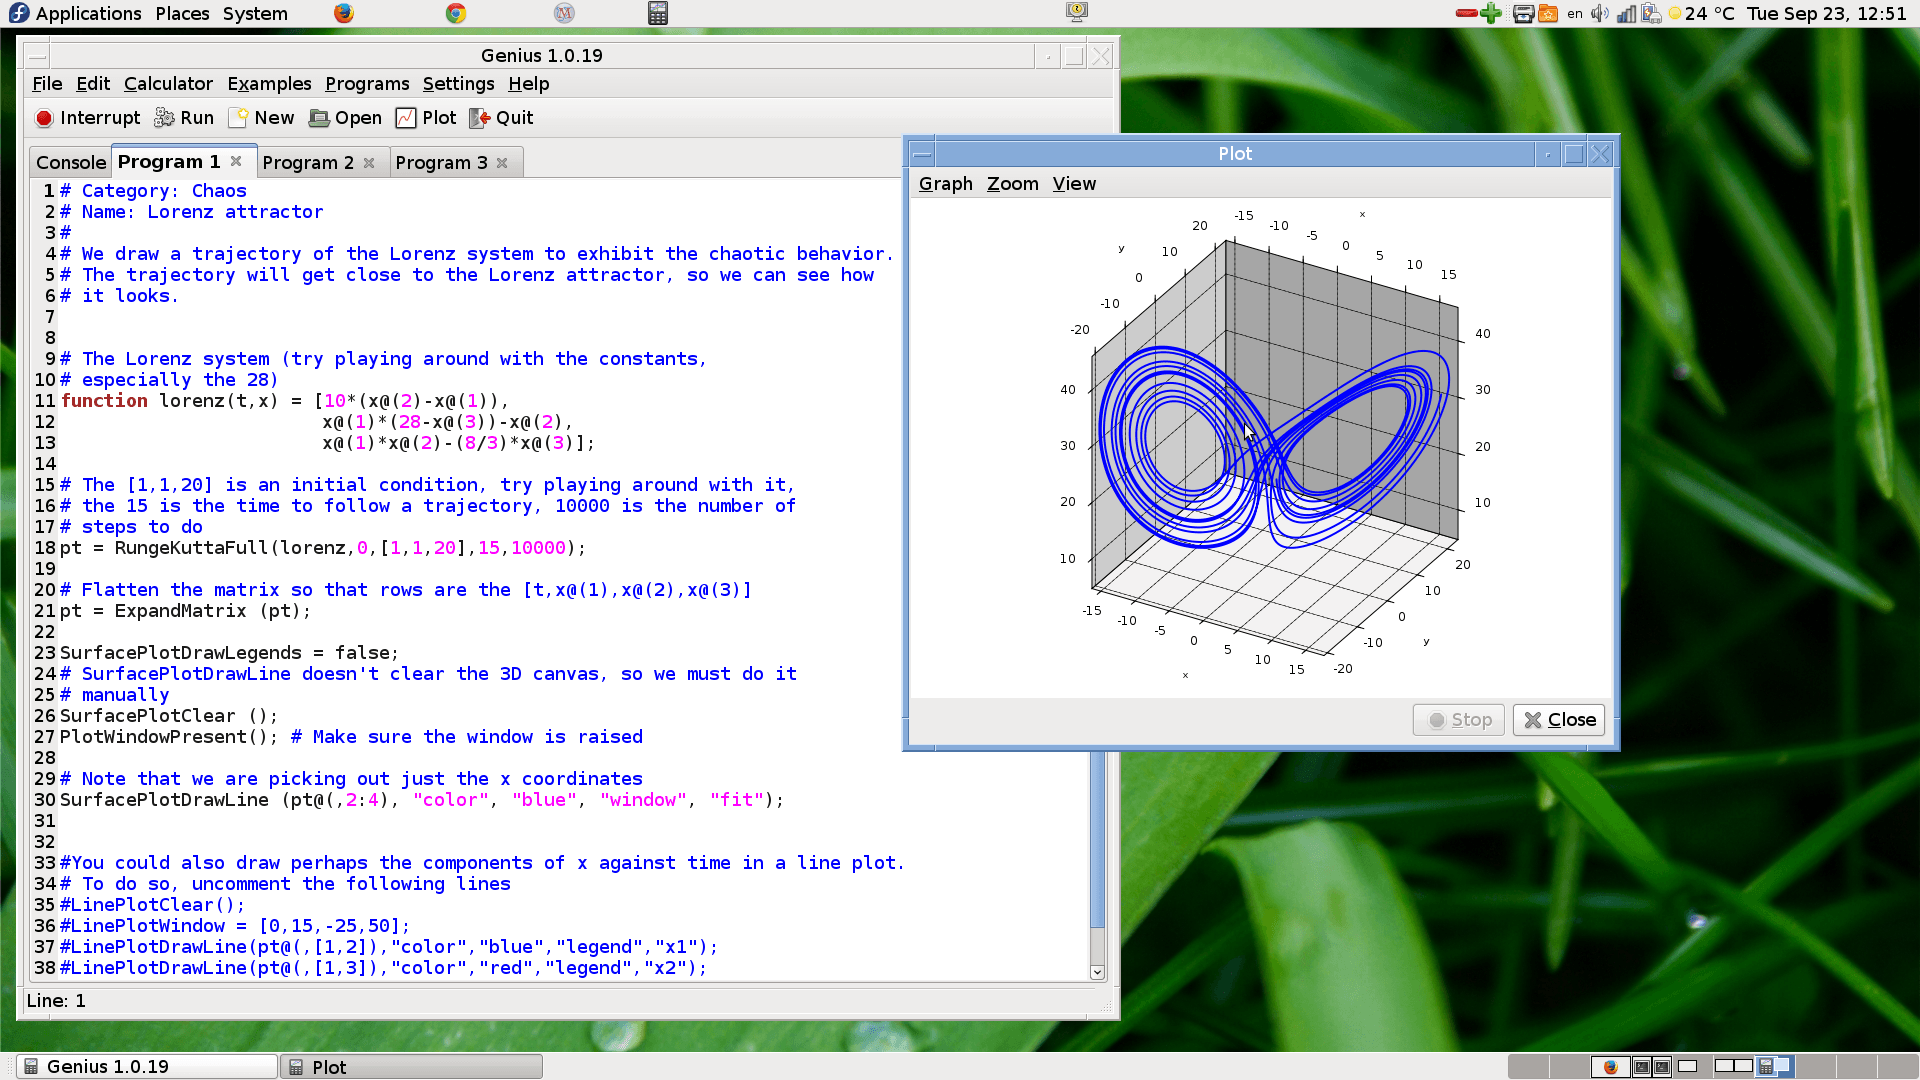
Genius is a versatile statistical calculator program comparable to BC, Matlab, Maple, and Mathematica. It is designed for simplicity and educational use, with an intuitive syntax that mirrors mathematical notation.
Its extension language, GEL, is used to write many of its standard functions. Genius supports arbitrary precision integers, multiple precision floats, rational numbers, and complex numbers, and aims to interpret math-like expressions as accurately as possible.
It is built for Linux and Unix systems.

Features
- Arbitrary precision integers, multiple precision floats.
- Rational numbers, stored as quotient and denominator.
- Complex numbers, stored in Cartesian coordinates as usual.
- Math-like-looking expressions, tries to be as much a what-you-mean-is-what-Genius-understands, up to a limit of course.
- Matrix calculations / Linear Algebra, with many related functions.
- Number theory.
- Calculus, numerical and even very limited symbolic calculations.
- Statistics, all the basic statistical functions.
- Numerical equation solving, polynomial roots, etc...
- Combinatorics.
- Most common elementary / trigonometric functions.
- Modular arithmetic, including inversions and modular arithmetic on matrices.
- A complete programming language, with automatic typing. In fact large part of Genius standard library is written in GEL.
- 2D Function line plots, standard 2D graphs of up to 10 functions at once, with possibility to export to EPS or PNG.
- Parametric plots, with possibility to export to EPS or PNG.
- 3D Function surface plots, with possibility to export to EPS or PNG
- Slopefield/Vectorfield plotting.
- GUI IDE where you can edit and run/test your programs.
- Can output matrices in LaTeX, Troff (eqn) or MathML, this is I think a very cool feature that allows you to copy stuff directly from Genius to a document in LaTeX, troff or MathML.
Platforms
- Linux: Ubuntu, Fedora, Arch Linux, Redhat, Gentoo
- Unix: FreeBSD, NetBSD
- Flathub

6. Sofa
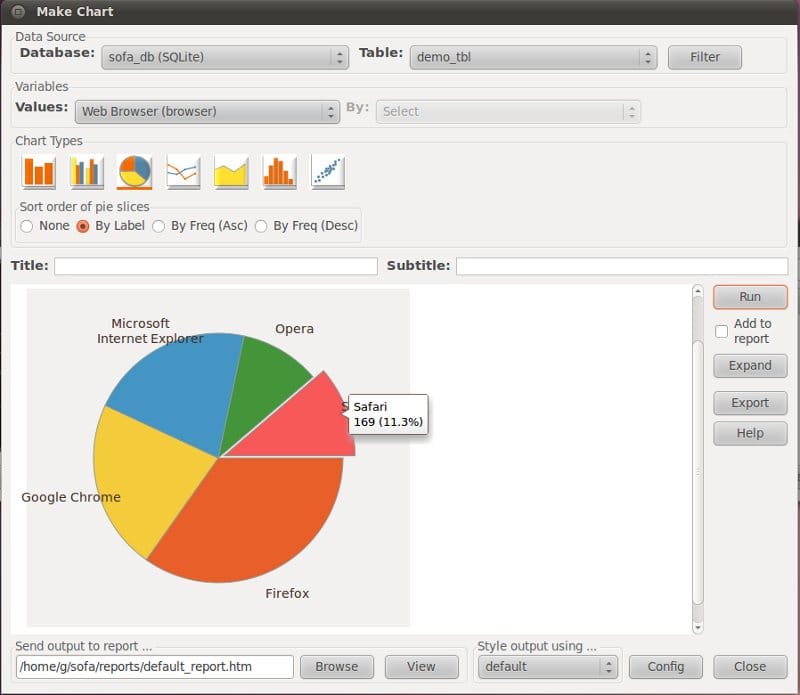
SOFA - Statistics is a free user-friendly, open-source statistics, analysis, and reporting package that allows users to create charts, produce attractive report tables, and perform a range of basic statistical tests.
Sofa is an ideal solution for students and anyone looking to perform statistical operations on small datasets.
As a user-friendly data tool, it allows users to connect to numerous SQL databases for data analysis. Supported databases include MySQL, MariaDB, SQLite, PostgreSQL, and MS SQL Server.
Platforms
- Windows
- Linux
- macOS
Features of SOFA
- User-friendly, open-source statistics, analysis, and reporting package
- Allows creation of charts and attractive report tables
- Performs a range of basic statistical tests
- Start screen for all actions
- Generates attractive, dynamic, web-friendly charts
- Helps users choose the correct statistical test
- Allows project configuration for keeping settings together
- Enables data viewing, editing, and addition of new records irrespective of database storage
- Allows creation of simple frequency tables and complex nested tables
- Works cross-platform (Windows, Mac, Ubuntu Linux)
- Released with open source AGPL3 licence
- Beautiful output suitable for presentations or automated reporting
- Database friendly: can connect directly to databases and edit data within SOFA
- Supports various databases: MySQL, Microsoft Access, SQLite, PostgreSQL, Microsoft SQL Server
- Spreadsheet friendly: can import data from Excel and ODS spreadsheets and export data into Excel format
- Data entry friendly: allows direct data addition to SOFA Statistics by configuring new tables
- Easy data recoding: provides a simple form for recoding data
- Shareable output: tabular output in HTML can be directly put on a website or in a spreadsheet
- Wide range of attractive, high quality charts: bar charts, pie charts, line charts, area charts, histograms, scatterplots, box and whisker plots
- Capability to create chart series
- Simplifies conduct and report on statistical options: Pearson's Chi-Square with Contingency Tables, Independent samples t-test, Paired samples t-test, One-way ANOVA, Mann Whitney U, Wilcoxon Signed Ranks, Kruskal Wallis H, Pearson's Correlation, Spearman's Correlation


7. ASCEND
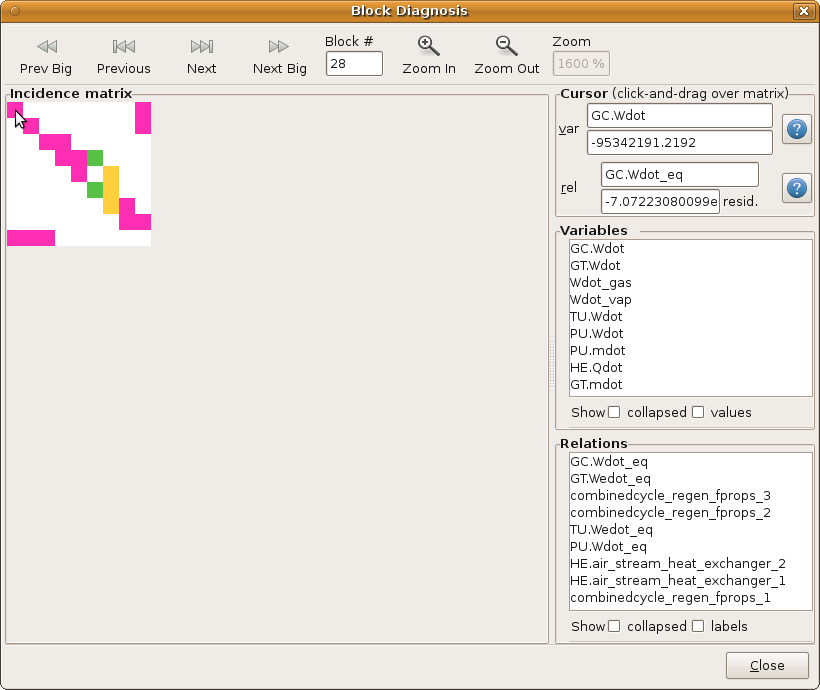
ASCEND is a free, open-source software that can handle mathematical models, including nonlinear equations, optimization problems, and differential/algebraic equations, suitable for solving small to very large problems.
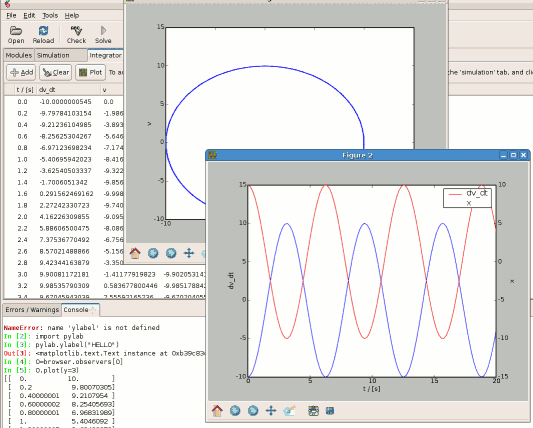
 ascend4
8. Gretl
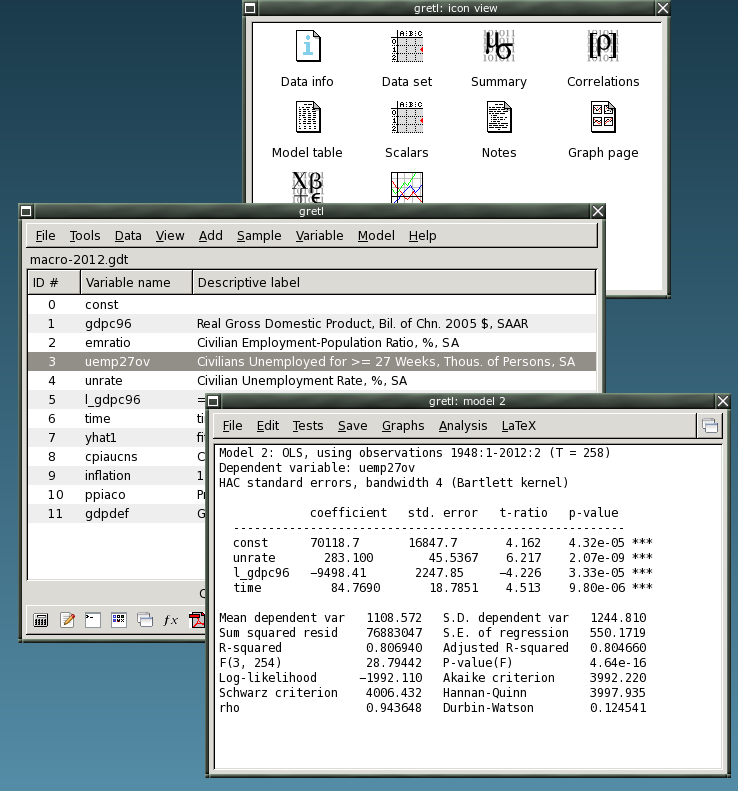
Gretl is a cross-platform software package for econometric analysis. It's written in the C programming language and is also available with a Graphical User Interface (GUI).
Gretl features a wide variety of estimators including, but not limited to, least squares, maximum likelihood, and GMM; along with standard time series models such as ARIMA and VAR. Furthermore, it also includes a scripting language, "hansl", which allows users to specify econometric models in a straightforward yet flexible manner.
Features
- Easy intuitive interface (now in French, Italian, Spanish, Polish, German, Basque, Catalan, Galician, Portuguese, Russian, Ukrainian, Turkish, Czech, Traditional Chinese, Albanian, Bulgarian, Greek, Japanese and Romanian as well as English)
- A wide variety of estimators: least squares, maximum likelihood, GMM; single-equation and system methods; regularized least squares (LASSO, Ridge, elastic net)
- Time series methods: ARIMA, a wide variety of univariate GARCH-type models, VARs and VECMs (including structural VARs), unit-root and cointegration tests, Kalman filter, etc.
- Limited dependent variables: logit, probit, tobit, sample selection, interval regression, models for count and duration data, etc.
- Panel-data estimators, including instrumental variables, probit and GMM-based dynamic panel models
- Output models as LaTeX files, in tabular or equation format
- Integrated powerful scripting language (known as hansl), with a wide range of programming tools and matrix operations
- GUI controller for fine-tuning Gnuplot graphs
- Facilities for easy exchange of data and results with GNU R, GNU Octave, Python, Julia, Ox and Stata
- Parallelization via MPI (details)
- Support for mixed time-series frequencies (MIDAS) (details)
- Support for machine learning via LIBSVM (details)
Platforms
- Windows
- Linux
- macOS

9. RKward
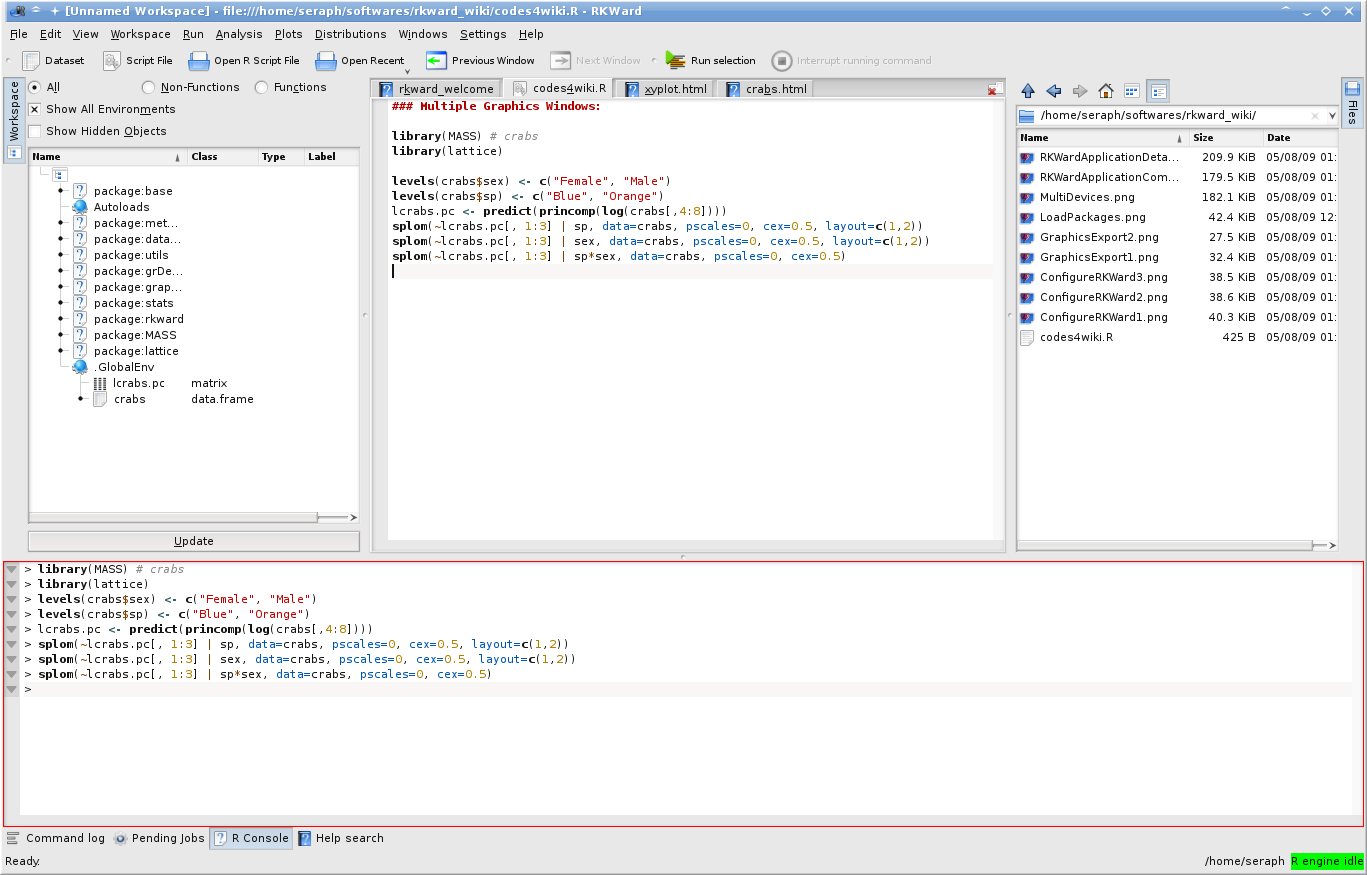
RKWard is an easy to use, transparent frontend to the R language, a very powerful, yet hard-to-get-into scripting-language with a strong focus on statistic functions. It will not only provide a convenient way of using R, but will also make advanced R functions available to users.
Features
- Easy-to-use, transparent frontend to the R language
- Easily extensible IDE/GUI for R
- Combines the power of the R-language with the ease of use of commercial statistics tools
- Spreadsheet-like data editor
- Syntax highlighting, code folding, and code completion
- Data import (e.g. SPSS, Stata, and CSV)
- Plot preview and browsable history
- R package management
- Workspace browser
- GUI dialogs for all kinds of statistics and plots
- Extensibility through plugins
- Free software

10. ADaMSoft
ADaMSoft is a free, open-source system for data management, data and web mining, and statistical analysis. It's compatible with multiple platforms and requires the Java Runtime Environment for use.
Features
- Free and open-source
- Compatible with multiple platforms
- Requires Java Runtime Environment for usage
- Facilitates data management, data and web mining, and statistical analysis
- Provides a more intuitive graphical user interface
- Allows usage across different platforms
- Single product for data integration, analytical ETL, data analysis, and reporting
- Powerful syntax for data recoding, modification, and transformation
- Easy access to common data sources and associated metadata
- Hundreds of statistical procedures for data analysis
- Integrates SQL syntax for managing data in a DBMS
11. Dap
Dap is a statistics and graphics package based on C that can read SBS programs. It provides core methods of data management, analysis, and graphics commonly used in statistical consulting practice.
It processes files one line at a time, allowing it to handle large data sets. Familiarity with basic C syntax is sufficient to use Dap's features.
admb-project12. ADMB or AD Model Builder
The ADMB project applies automatic differentiation for non-linear statistical modeling and optimization solutions. ADMB, a statistical application, implements this using C++ classes and a native template language, with its source code available on GitHub.
The ADMB project has dozens of tools that include AD studio, editors, runtimes for Windows, R integration and more.

 admb-project
13. Knime
KNIME, or Konstanz Information Miner, is a free and open-source data analytics, reporting, and integration platform.
It integrates various components for machine learning and data mining through its modular data pipelining concept and provides a graphical user interface allows assembly of nodes for data preprocessing, for modeling and data analysis and visualization.
14. Mondrian
Mondrian is a general-purpose statistical data-visualization system with strengths in handling categorical, geographical, and large data.
It offers interactive, fully linked plots, including histograms, boxplots, scatterplots, barcharts, mosaic plots, missing value plots, parallel coordinates/boxplots, SPLOMs, and maps. Mondrian works with standard tab-delimited or comma-separated ASCII files and can load data from R workspaces.
Mondrian is written in JAVA and is distributed as a native application (wrapper) for MacOS X and Windows. Linux users need to start the jar-file. The latest version can be downloaded here.
15. Simfit
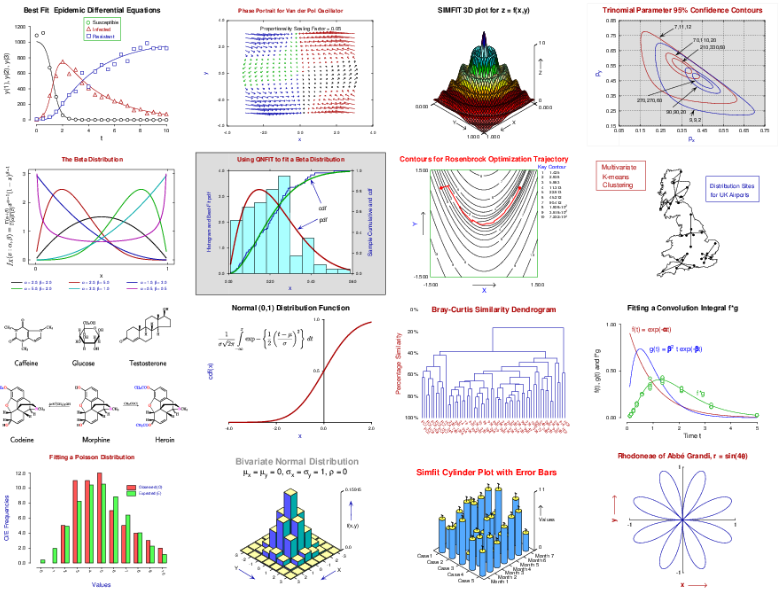
Simfit is a free, open-source software for Windows and Linux that offers simulation, curve fitting, statistics, and plotting. It includes forty dedicated programs for various aspects of data analysis and provides a reference manual, tutorials, and worked examples.
It can be used in:
- biology (nonlinear growth curves);
- ecology (Bray-Curtis dendrograms);
- psychology (factor analysis);
- physiology (membrane transport);
- pharmacology (dose response curves);
- pharmacy (pharmacokinetics);
- immunology (ligand binding);
- biochemistry (calibration);
- biophysics (enzyme kinetics);
- epidemiology (survival analysis);
- medical statistics (meta analysis);
- chemistry (chemical kinetics);
- physics (dynamical systems); and
- mathematics (numerical analysis).
16. Python Statistical Packages
Python, with its extensive ecosystem of libraries and tools, serves as a comprehensive alternative to SPSS for data analysis and statistics. data-focused libraries provide robust capabilities for data manipulation, mathematical functions, statistical modeling, data visualization, and machine learning applications.
1- NumPy
NumPy is a library for the Python programming language, adding support for large, multi-dimensional arrays and matrices, along with a large collection of high-level mathematical functions to operate on these arrays.
2- Pandas
Pandas is a Python library offering data manipulation and analysis capabilities, particularly for relational or labeled data. It is a key component of data science and analysis in Python.
3- Bokeh
Bokeh is an interactive visualization library in Python that provides elegant, concise construction of versatile graphics, and affords high-performance interactivity over large or streaming datasets. This makes it a great tool for creating dashboards or other web-based data applications.
4- SciPy
SciPy is a free and open-source Python library used for scientific computing and technical computing. It is a collection of mathematical algorithms and convenience functions built on the NumPy extension of Python.
It adds significant power to the interactive Python session by providing the user with high-level commands and classes for manipulating and visualizing data.
5- Scikit-learn
Scikit-learn is a free software machine learning library for the Python programming language.
It features various classification, regression and clustering algorithms including support vector machines, random forests, gradient boosting, k-means, and DBSCAN, and is designed to interoperate with the Python numerical and scientific libraries NumPy and SciPy.
6- Seaborn
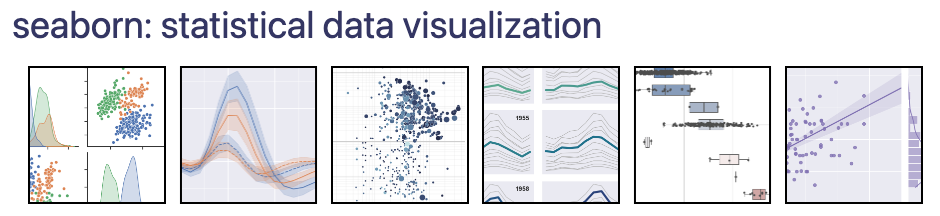
Seaborn is a Python data visualization library based on matplotlib. It provides a high-level interface for drawing attractive and informative statistical graphics.
7- StatsModels
StatsModels is a Python module used for estimating various statistical models, conducting statistical tests, and exploring statistical data.
8- PyMC3
PyMC3 is a Python package for Bayesian statistical modeling and Probabilistic Machine Learning which focuses on advanced Markov chain Monte Carlo and variational fitting algorithms. Its flexibility and extensibility make it applicable to a large suite of problems.
9- Matplotlib
Matplotlib is a plotting library for the Python programming language. It provides an object-oriented API for embedding plots into applications using general-purpose GUI toolkits like Tkinter, wxPython, Qt, or GTK. Matplotlib is also a popular library for creating static, animated, and interactive visualizations in Python.
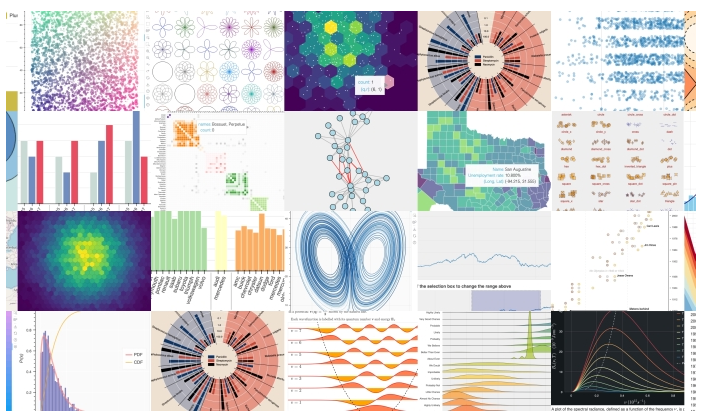
17. Plot
Hazem
18. SciDAVis
HazemHazem