Visualization
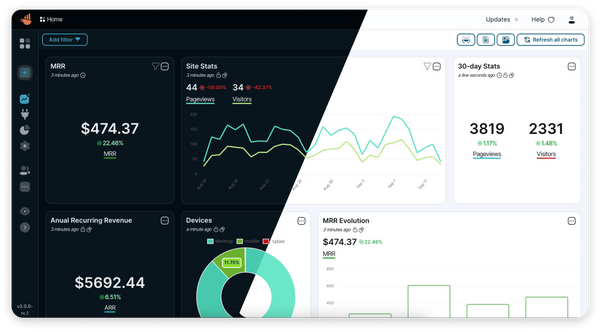
Chartbrew: Open-source Web App to Connect Databases and APIs
Open-source web platform used to create live reporting dashboards from APIs, MongoDB, Firestore, MySQL, PostgreSQL, and more 📈📊
Visualization
Open-source web platform used to create live reporting dashboards from APIs, MongoDB, Firestore, MySQL, PostgreSQL, and more 📈📊
BI
This is a small lightweight Python + JavaScript project that enables you to scrap Google Map leads in almost no time. Features 1. Scrape up to 1200 Google Map Leads in just 25 minutes, providing you with an extensive pool of potential customers to drive sales. 2. Access 30 Data Points,

Open-source
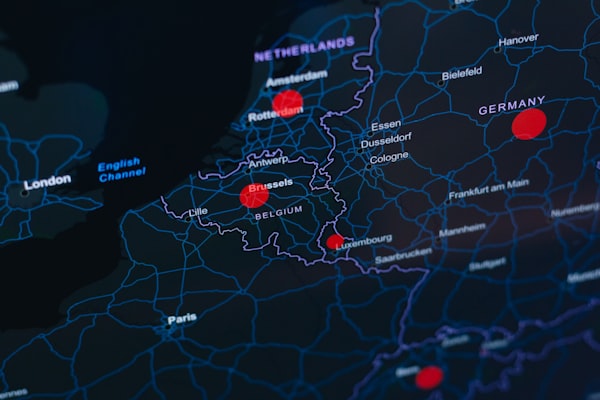
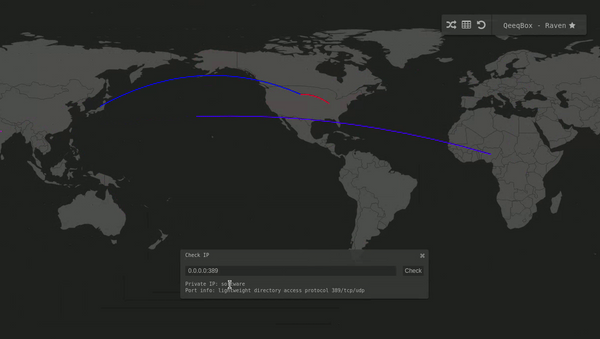
Raven - Advanced Cyber Threat Map (Simplified, customizable and responsive. It uses D3.js with TOPO JSON, has 247 countries, ~100,000 cities, and can be used in an isolated environment without external lookups!.
data analysis
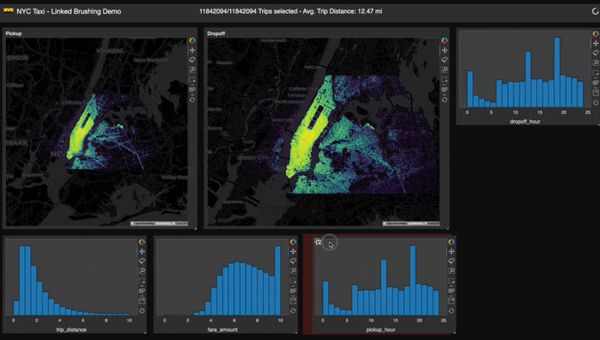
Panel is an open-source Python library that lets you easily build powerful tools, dashboards, and complex applications entirely in Python. It has a batteries-included philosophy, putting the PyData ecosystem, powerful data tables and much more at your fingertips. Features High-level reactive APIs and lower-level callback based APIs ensure you can
data analysis
Business Intelligence, commonly known as BI, is the process of collecting, analyzing, and presenting data to make informed business decisions. BI helps organizations to transform their raw data into meaningful insights that can drive their business strategies. BI provides a range of advantages to organizations, including improved decision-making, increased efficiency,
Cybersecurity
Advanced Cyber Threat Map (Simplified, customizable, responsive and optimized)
Crisis Management
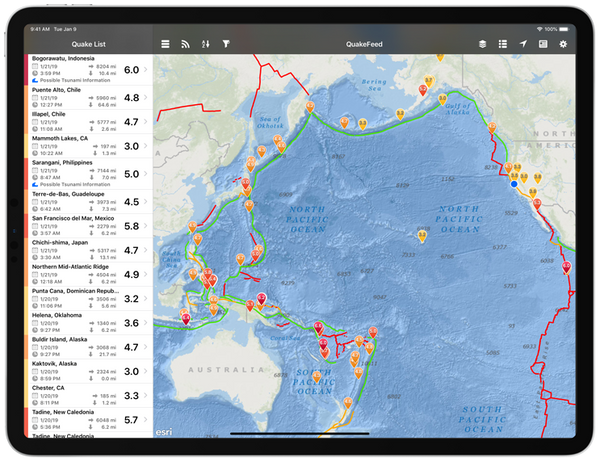
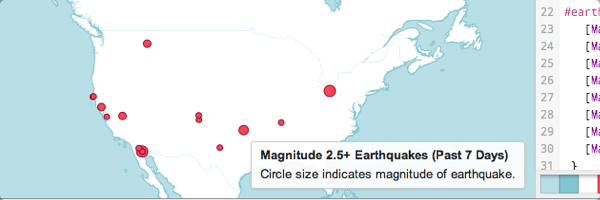
QuakeFeed is a lightweight free iOS app that notify and alert users with earthquakes. It uses multiple sources, uses an interactive map, and contains a historical data back to 1900. With its latest update, the app also supports wildfires, hurricanes, and erupting volcanoes. Features 1. Simple clutter-free interface 2. Browse
Frameworks
Create beautiful SVG maps in react with d3-geo and topojson using a declarative api.

Sport
Bike Router is an interactive open-source map app that can help you plan your cycling trips. It allows you to set the start point, end point and several mid-points for your trip. It calculates and display the path, distance, and routes on a map and a visual graph. The project
Visualization
Designing maps might seem easy, but it is not, especially when many tools require certain levels of technical knowledge. A good map design can promote your presentation, website, and increase your work exposure. Data scientists, business analysts, marketeers, advertisers, and many other professions require map design in their daily work.
JavaScript
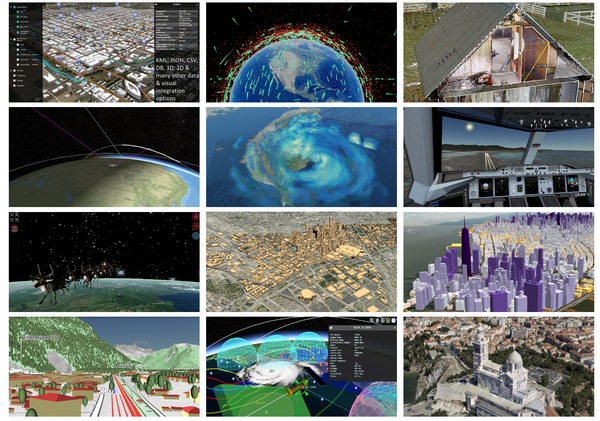
CesiumJS is a JavaScript library for creating 3D globes and 2D maps in a web browser without a plugin. It uses WebGL for hardware-accelerated graphics, and is cross-platform, cross-browser, and tuned for dynamic-data visualization. CesiumJS can stream 3D content such as terrain, imagery, and 3D Tiles from the commercial Cesium

Open-source
Pi Zero Bikecomputer offers you a complete open-source guide and tools to build your own GPS cycling computer with Raspberry Pi Zero (W, WH, 2W). The project is the brain child of Hishizuka, who is a cyclist and a developer as well from Japan. Pi Zero Bikecomputer is a GPS
maps
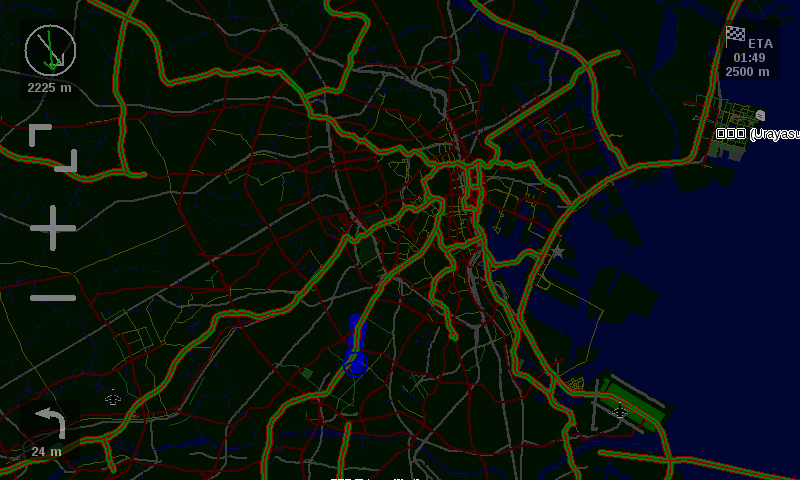
The open source (GPL v2) turn-by-turn navigation software for many OS
Sport
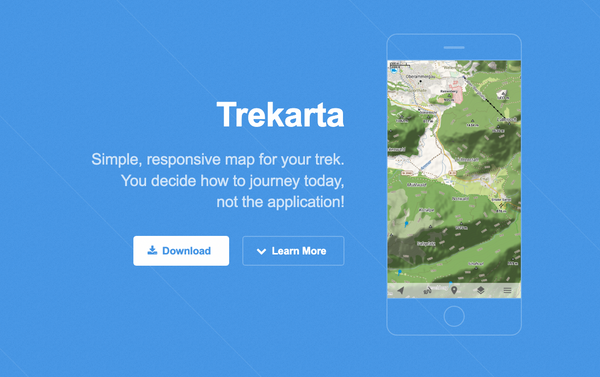
Trekarta (former MapTrek) is designed for hiking, geocaching, off-roading, cycling, boating and all other outdoor activities. It uses offline maps, so you do not need to have internet connection. Trekarta is developed as a hobby for personal use but is generously shared to public on as-is basis. Developers are welcome

Open-source
Configurable OSM offline router with elevation awareness, Java + Android
Visualization
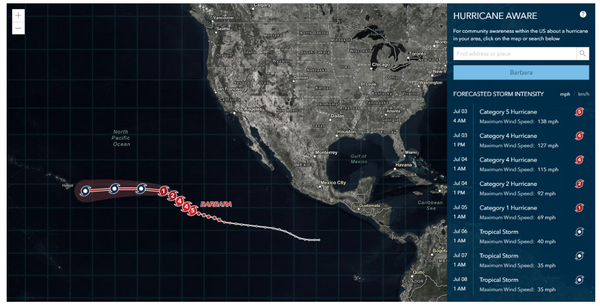
The Hurrican Aware App is a free open-source web application that track, collect, visualize and share information about the potential impacts of tropical storms in the United States. The app uses ArcGIS Living Atlas of the World, ArcGIS JavaScript API, D3.js for the map visualization and React.js. How
maps
TileMill is a modern map design studio powered by Node.js and Mapnik.
programming
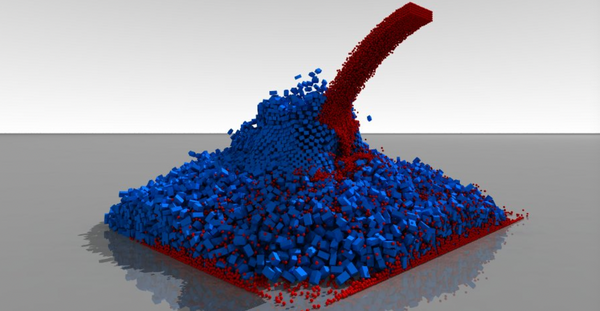
What is a physics simulation engine? A physics simulation engine is a custom software engine that grants developers add visual effetcs, simulate and tweak objects and enviroments accroding to the law of physics in 2D, 3D or both. With physics engine software, developers and artists apply real-world physical properties, such
Visualization
TerriaJS is an open-source framework for web-based geospatial catalog explorers.
radiology
What is SIVIC? SIVIC is an open-source, standards-based software framework and application suite for processing and visualization of DICOM MR Spectroscopy data. Through the use of DICOM, SIVIC aims to facilitate the application of MRS in medical imaging studies. Features * Dynamic MRS * Multi-volumetric images (multi-time point or multi-channel images) * Perfusion
Open-source
What is Plots? Plots is a graph plotting app for GNOME. Plots makes it easy to visualize mathematical formulae. In addition to basic arithmetic operations, it supports trigonometric, hyperbolic, exponential and logarithmic functions, as well as arbitrary sums and products. It can display polar equations, and both implicit and explicit
web development
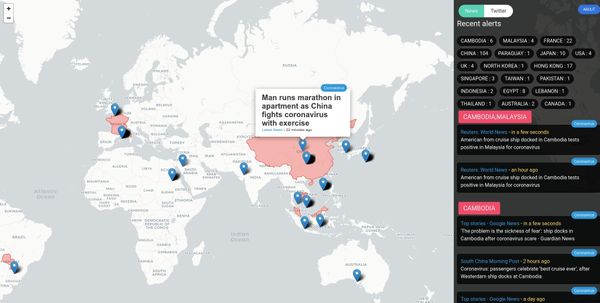
Medevel's Outbreak Monitor: is a free web monitoring service for outbreaks, It is a necessary tool I built to help people stay updated with the country-specific news. Currently, The system is monitoring hundreds of news sources and Twitter public feed for country-based news. We have created this page

Visualization
CamiTK (Computer Assisted Medical Intervention Tool Kit) is a Free Open Source Application and Framework developed at the TIMC-IMAG laboratory of the Grenoble University, France. It helps researchers and clinicians to easily and rapidly collaborate in order to prototype CAMI applications, that feature medical images, surgical navigation and biomechanical simulations.
Artificial Intelligence
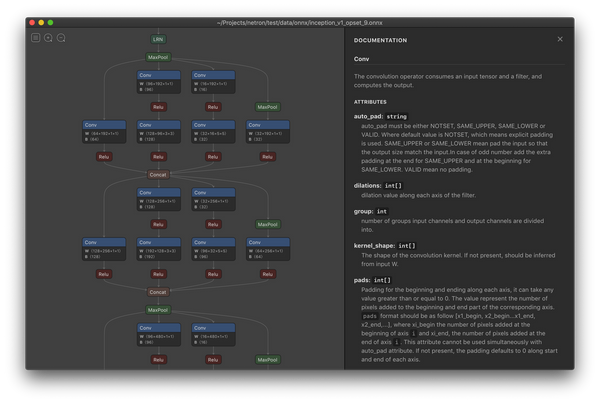
Netron is an open-source multi-platform visualizer and editor for artificial intelligence models. It supports many extensions for deep learning, machine learning and neural network models. Netron is using Electron/ NodeJS and it has a binary application release for Windows, Linux and macOS. Netron is popular among data scientists, The project&